Create A Predominance Map
Time to complete - 5 minutes
Tools required - LibreOffice Calc, Azimap
Step 1 - Download and extract shape file
Sample files to download: UK Election Results 2015.zip
Extract zip to a folder.
Step 2 - Edit attribute data using LibreOffice
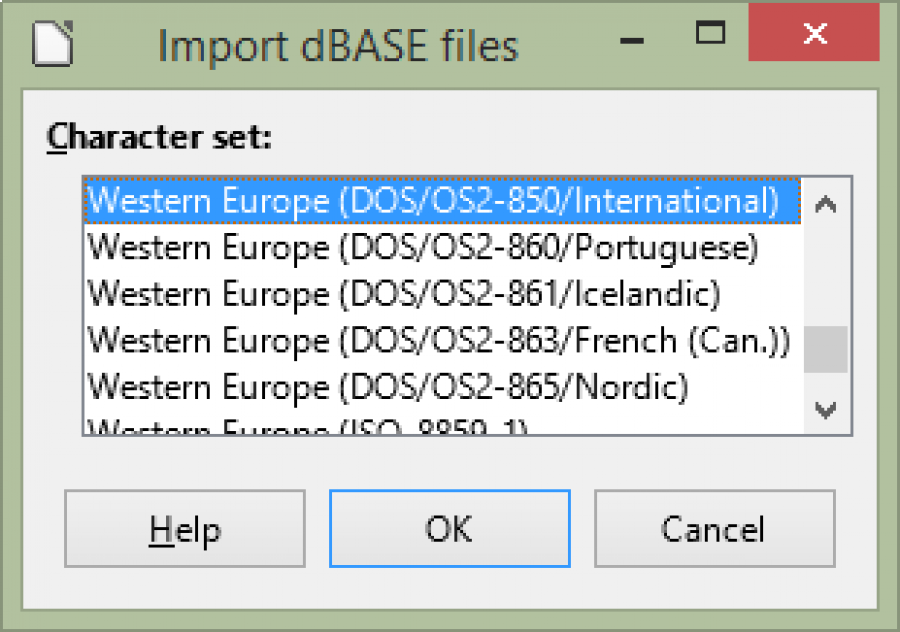
Open the .dbf file "GB&NI_Election2015.dbf" with LibreOffice Calc
Accept the default character set.
We are going to add three new columns (attributes) to the .dbf file.
These are -
- Winner - the resultant elected party
- NumVotes - the number of votes the winner achieved
- PercVotes - the percentage of the votes cast the winner received
We have to define the column structure so each new column should be set as
WINNER,C,254 - varchar, 254 characters
NUMVOTES,N,10 - number 10 digits
PERCVOTES,N,10 - number 10 digits
NB care must be taken that the data inserted in the created columns matches the above structure.
In the WINNER column ROW 2 use the formula
=INDEX(I1:X1,0,MATCH(MAX(I2:X2),I2:X2,0))
Here we are trying to return the column header to the cell of the highest value in the range. To do this we can apply a combination of INDEX, MATCH and MAX functions to get the result.
We want to make the index range static rather than relative for this so select the first
I1:X1and press F4 which will make it static
=INDEX($I$1:$X$1,0,MATCH(MAX(I2:X2),I2:X2,0))
In the NUMVOTES column ROW 2 use the formula
=MAX(I2:X2)This will select the highest number in the range
In the PERCVOTES column ROW 2 use the formula
=Z2/K2
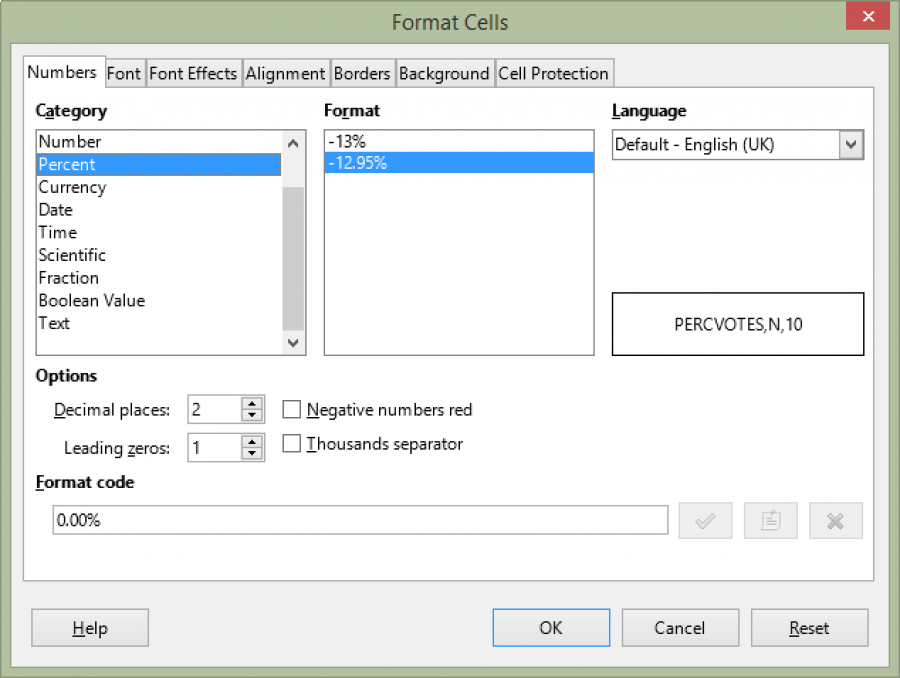
Right Click on the PERCVOTES column and choose format cells
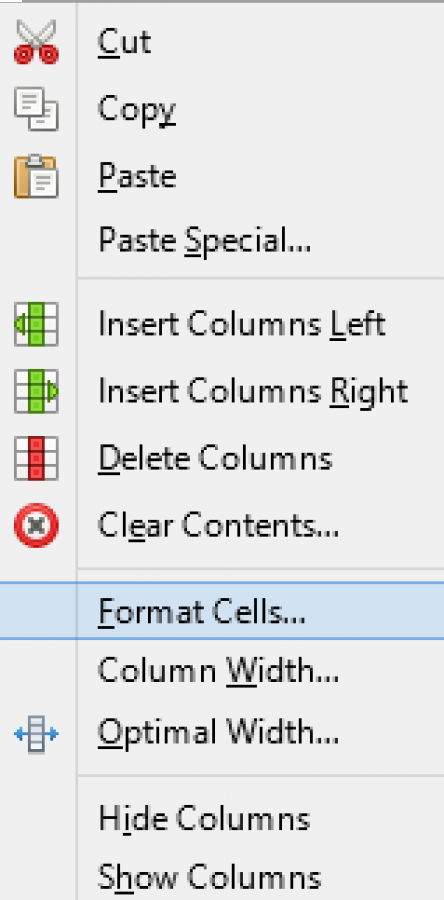
Set the column category to percent and click OK
Select all of the rows in the three new columns except the headers
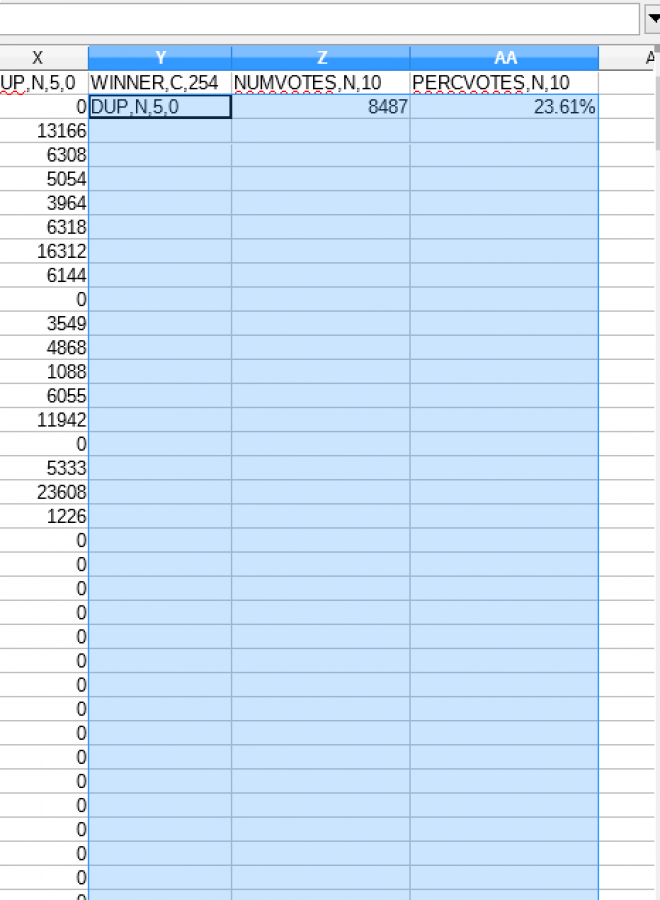
use CTRL-D to copy the content of the first row selected into the other rows
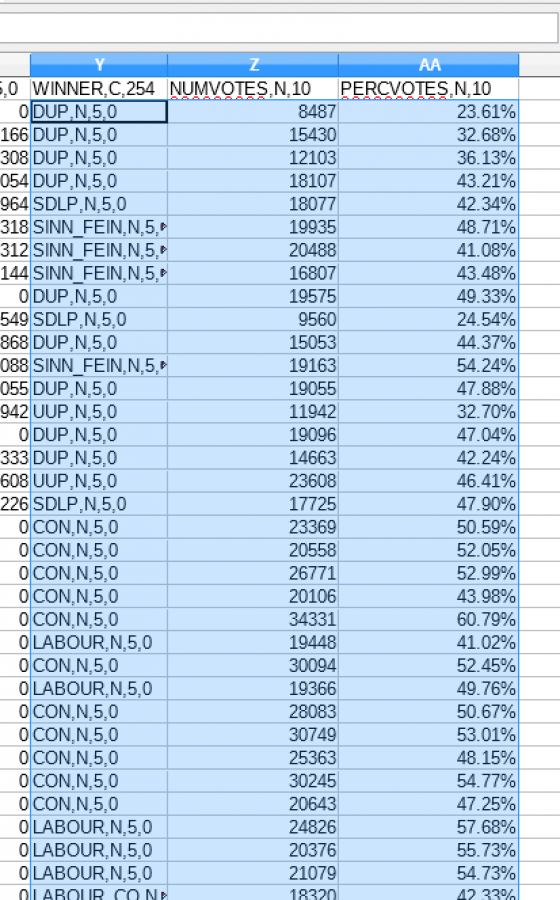
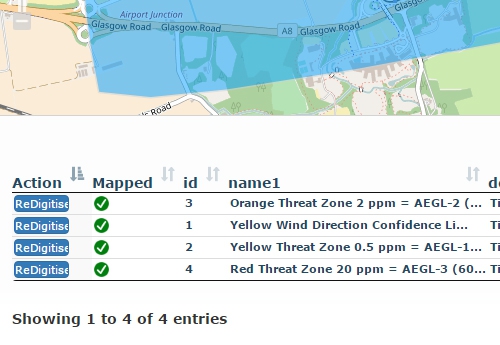
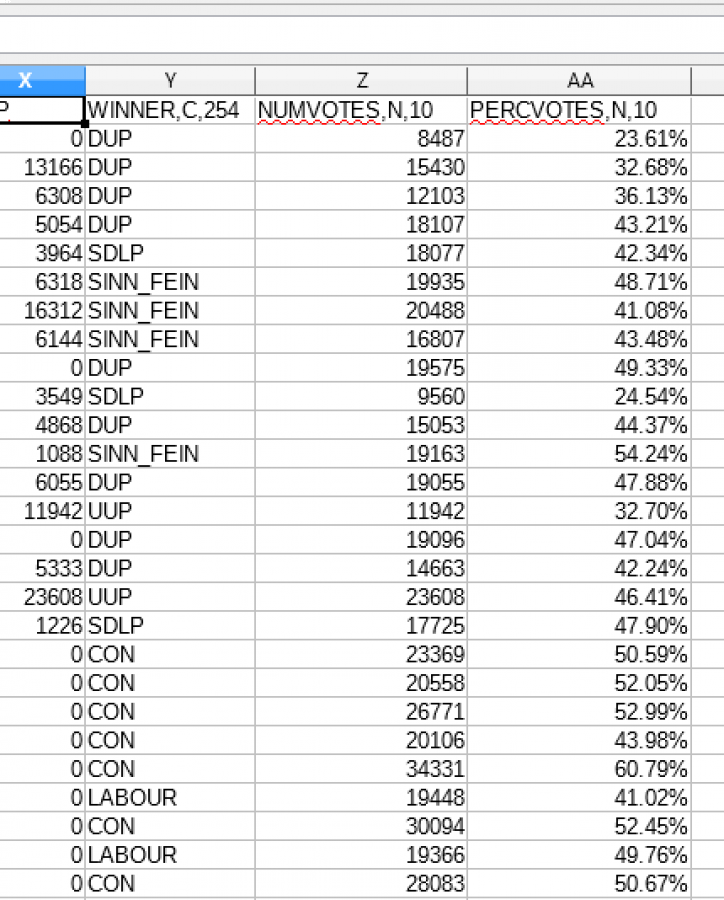
Nearly done on the data work, as you can see from the above screenshot, unfortunately LibreOffice Calc copies the structure information of the header into the winner column. To solve this delete the structure data from the applicable header cells.
Change

to

Result
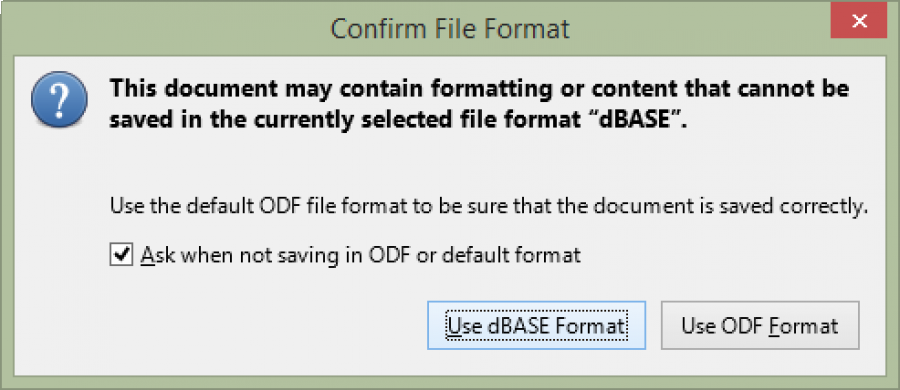
Save your amended file as a dBASE file (default)
That's it, all data preparation is now complete - let's make the map.
Step 3 - Select Maps in the global navigation and seclect 'create new map'

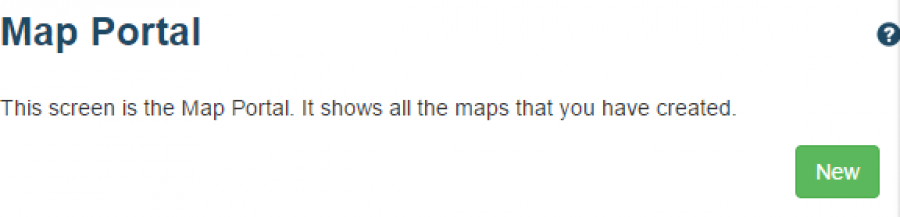
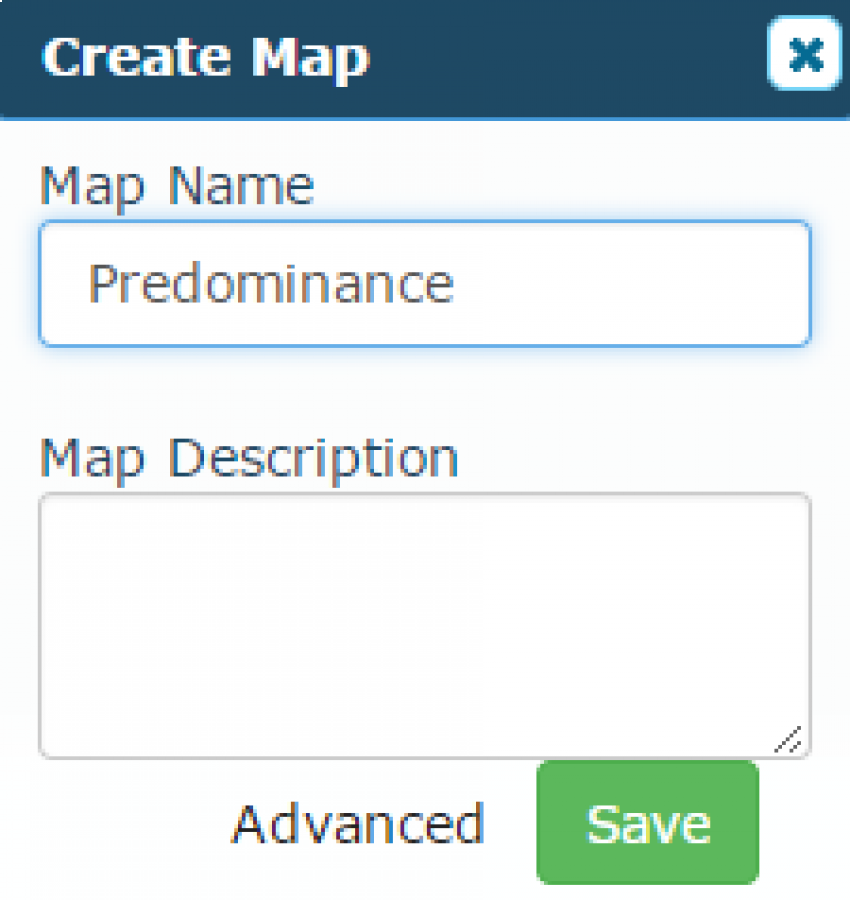
Name you new map and select save
Step 4 - Create map and upload data
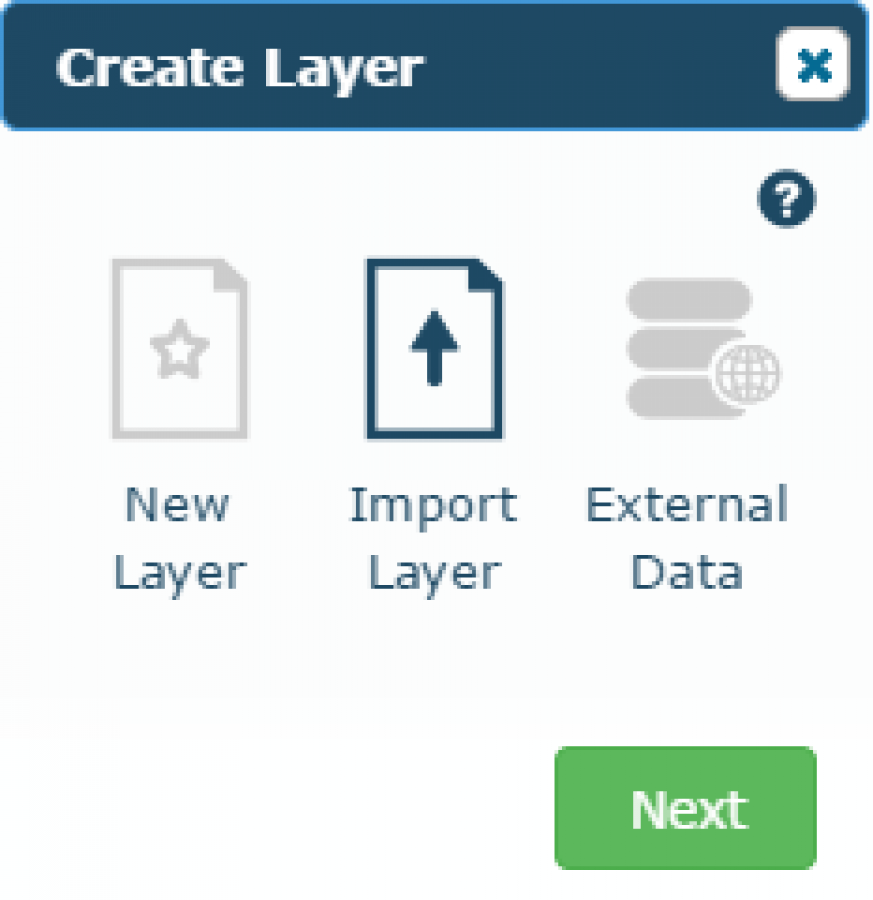
When you try to load a map without any layers attached you get the below window.
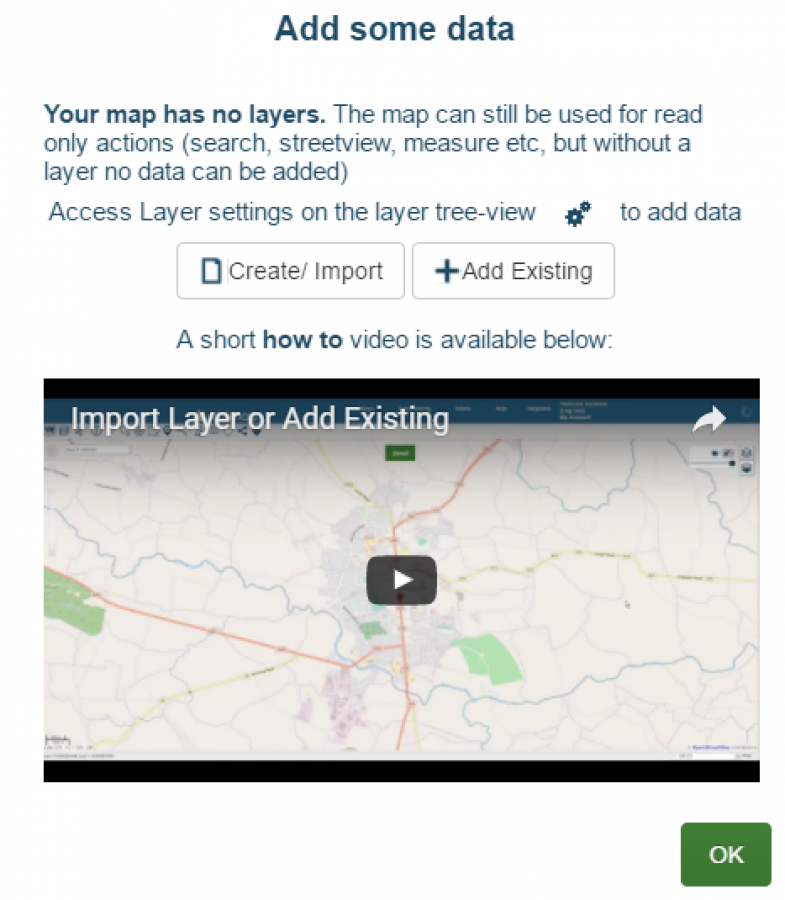
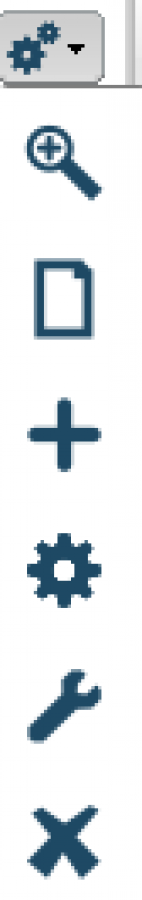
Choose the create / import button (this is accessible on the map using the gears button on the layer tree view
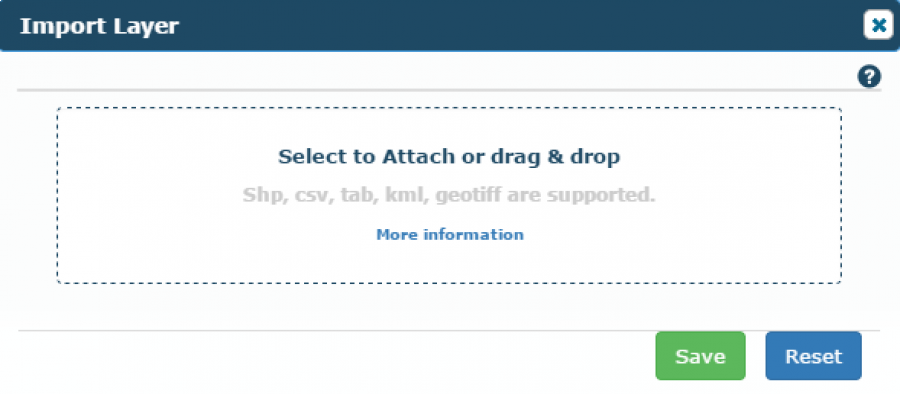
Select Import
Re-zip all of the shape file (quicker to upload) and drag and drop to the DnD area
Rename your layers after upload if you desire. Upload may take a few minutes depending on file size.
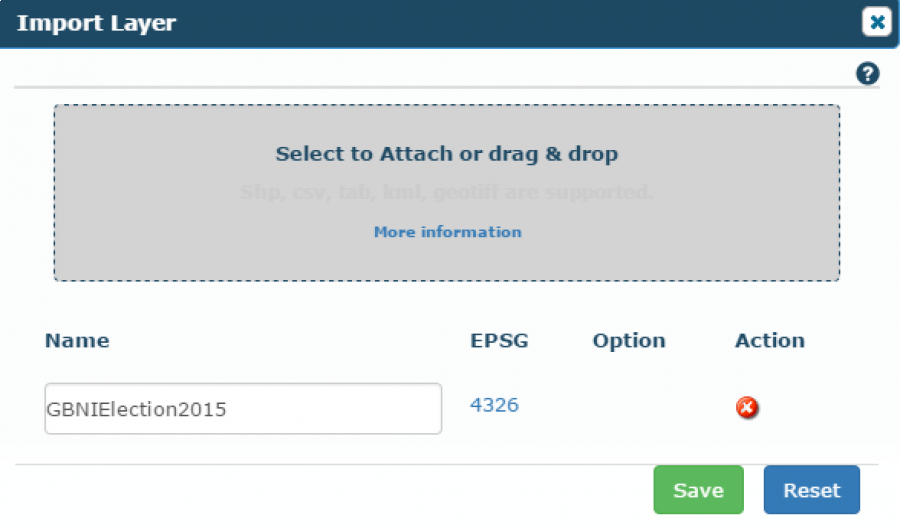
Select Save to import
Step 4 - Style the data
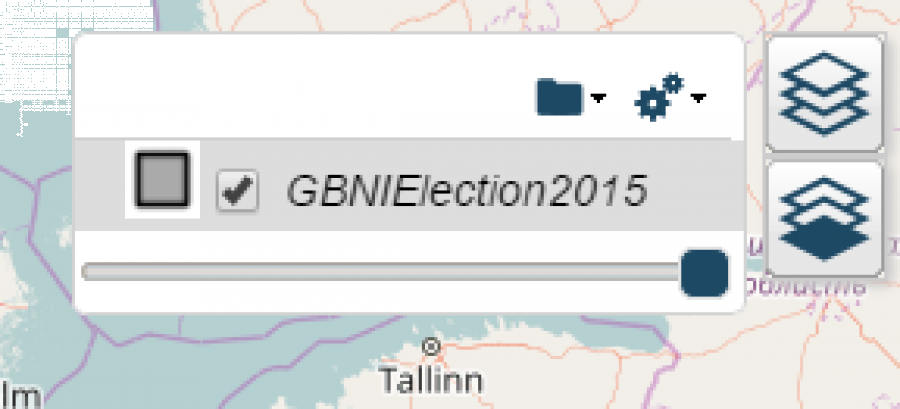
The layer will load with the default polygon layer styles (black outline, grey polygon)
Click on the style preview icon next to the layer name in layer chooser to modify the style
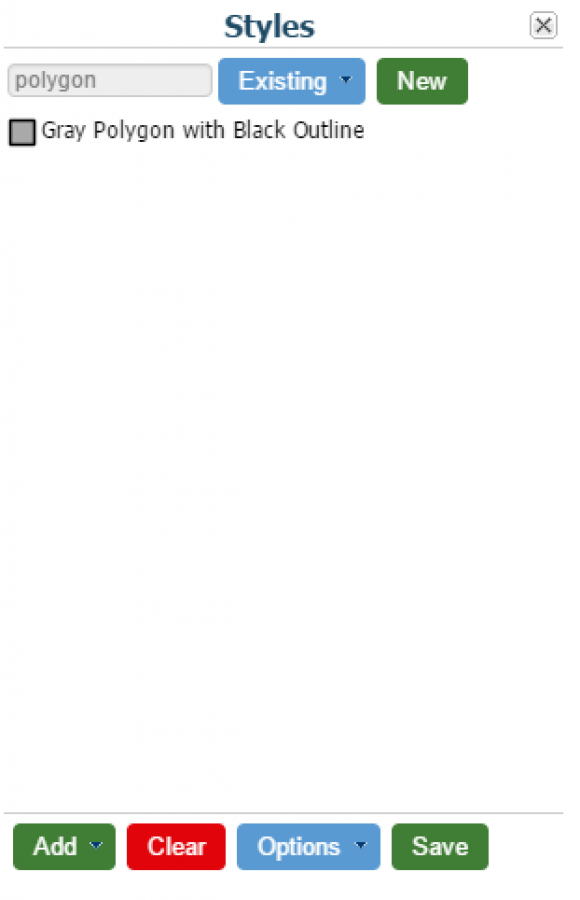
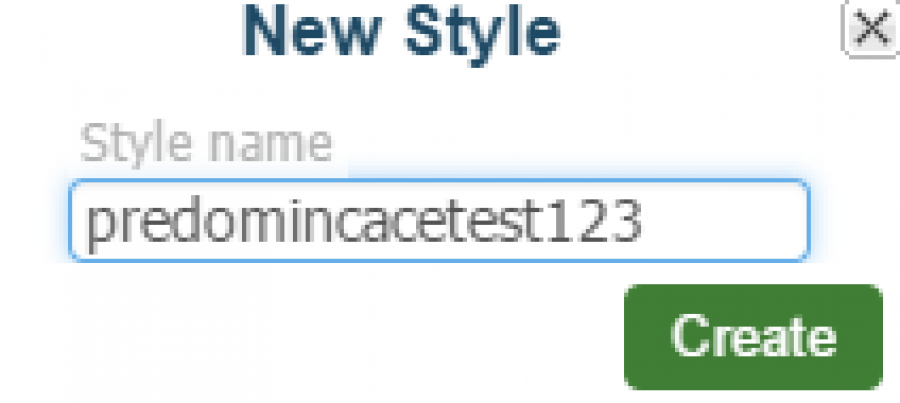
Select New to create a new style
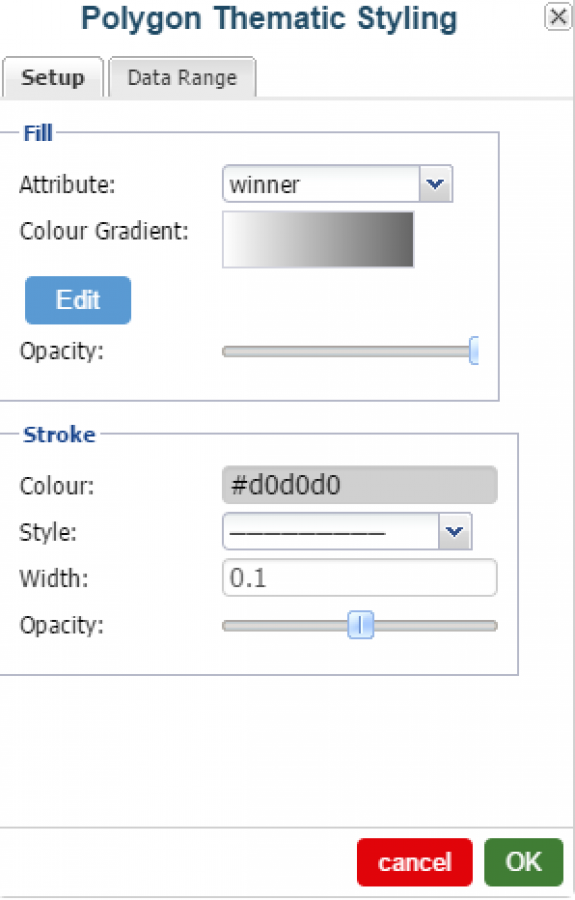
Select ADD and choose "polygon thematic styling" wizard
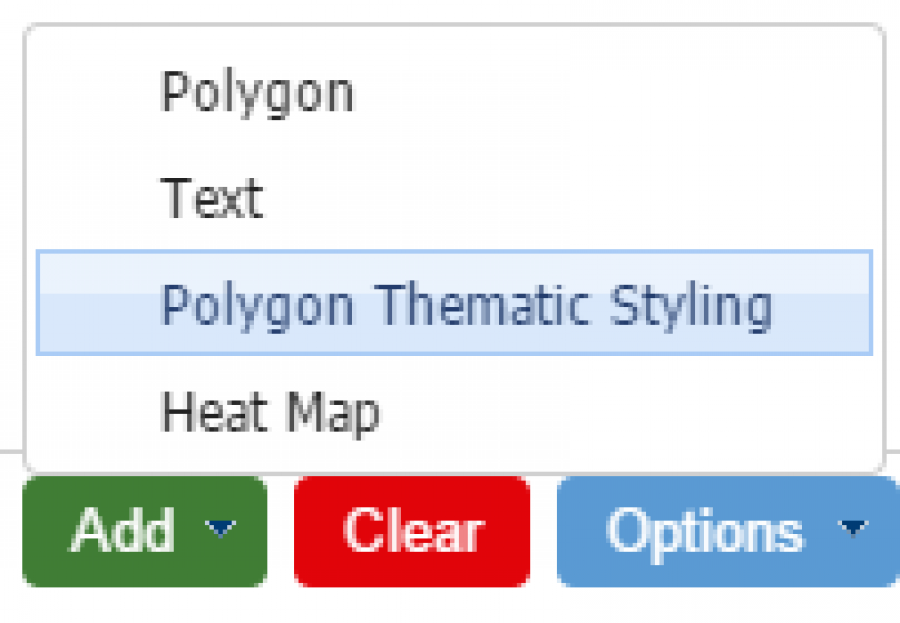
Select the attribute you want to style against. For this example we will use the previously created "winner" column.

Change the style options as you see fit. For this example we have set stroke width to 0.1 and stroke opacity to 50%
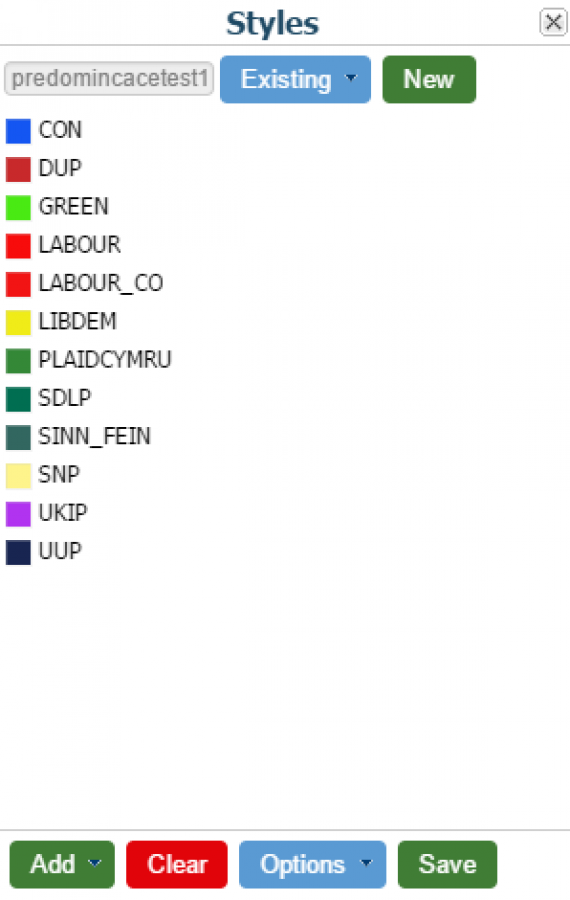
Select the 'Data Range' tab to set the colours for your autogen style
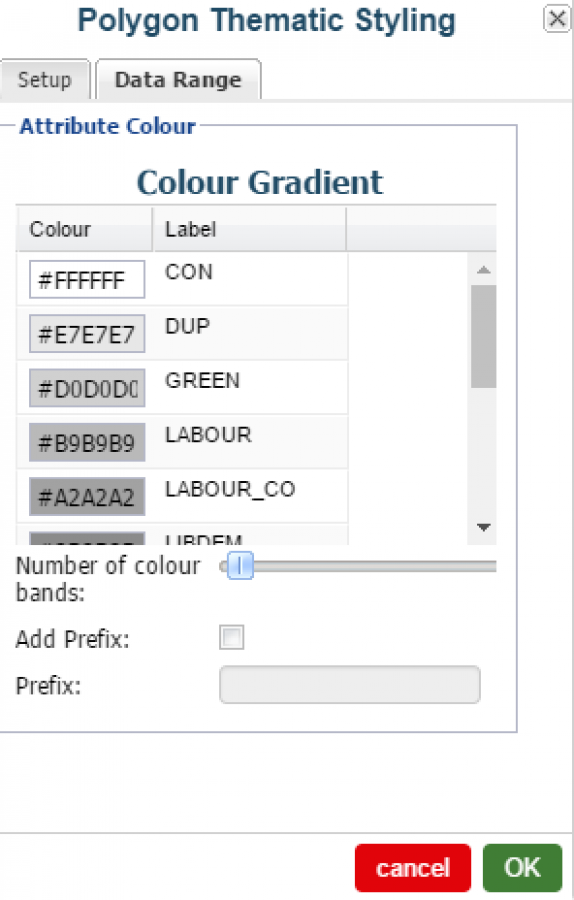
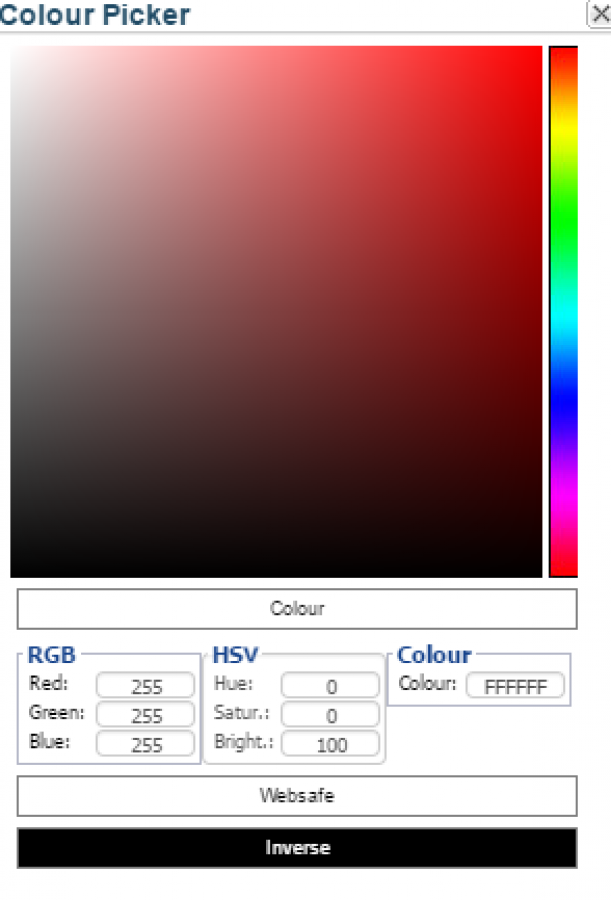
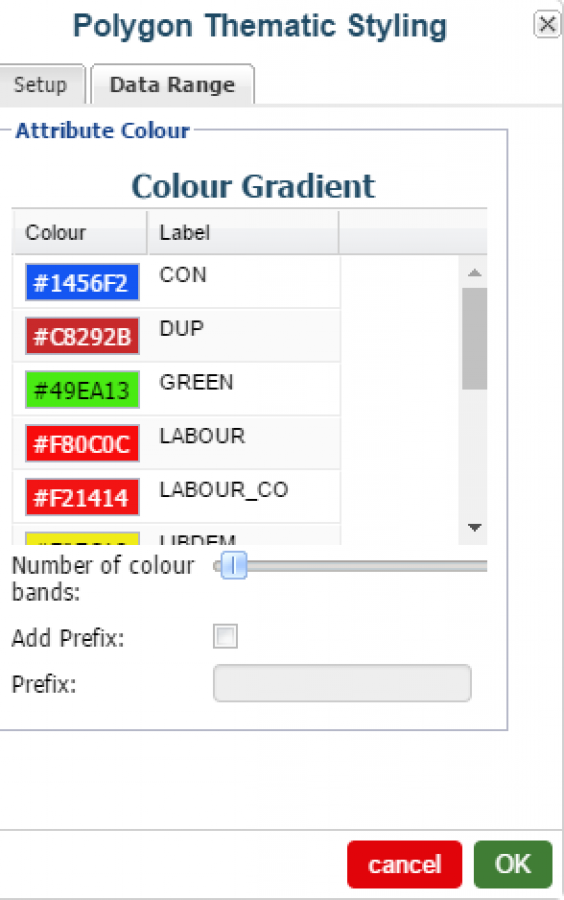
Click on the colour or enter your hex code to set your desired colour
After you have entered your desired colours, select OK to exit
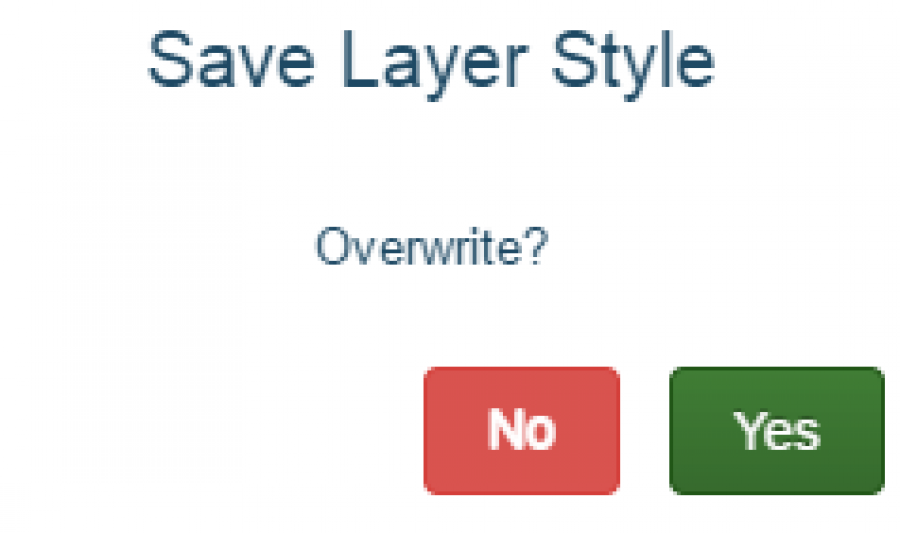
If you are happy with the style select 'Save'. Click YES to save as current style or NO to give the style a new name.
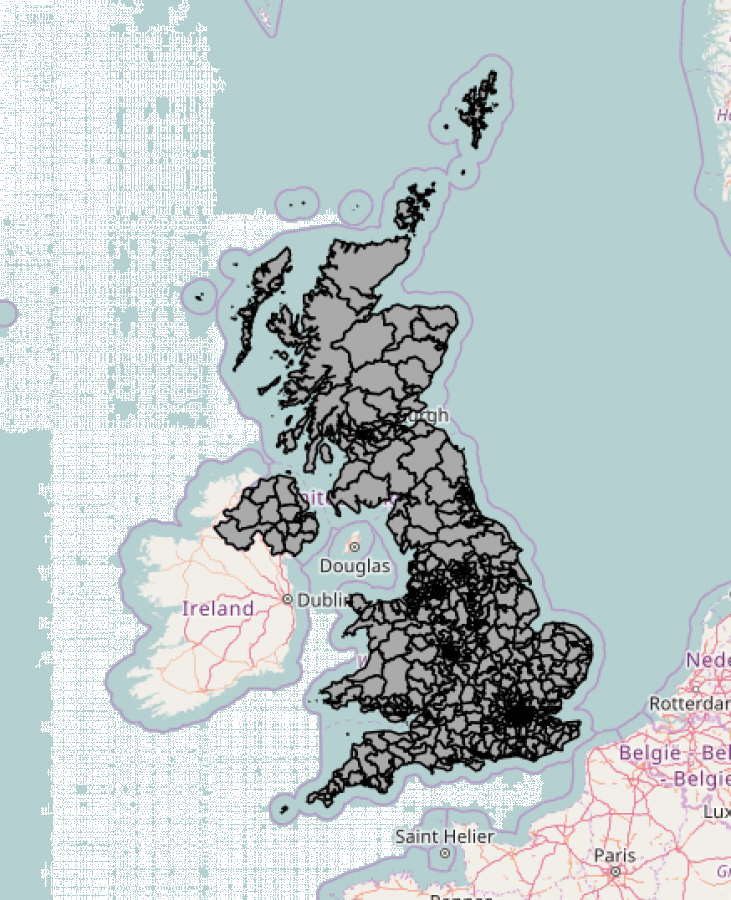
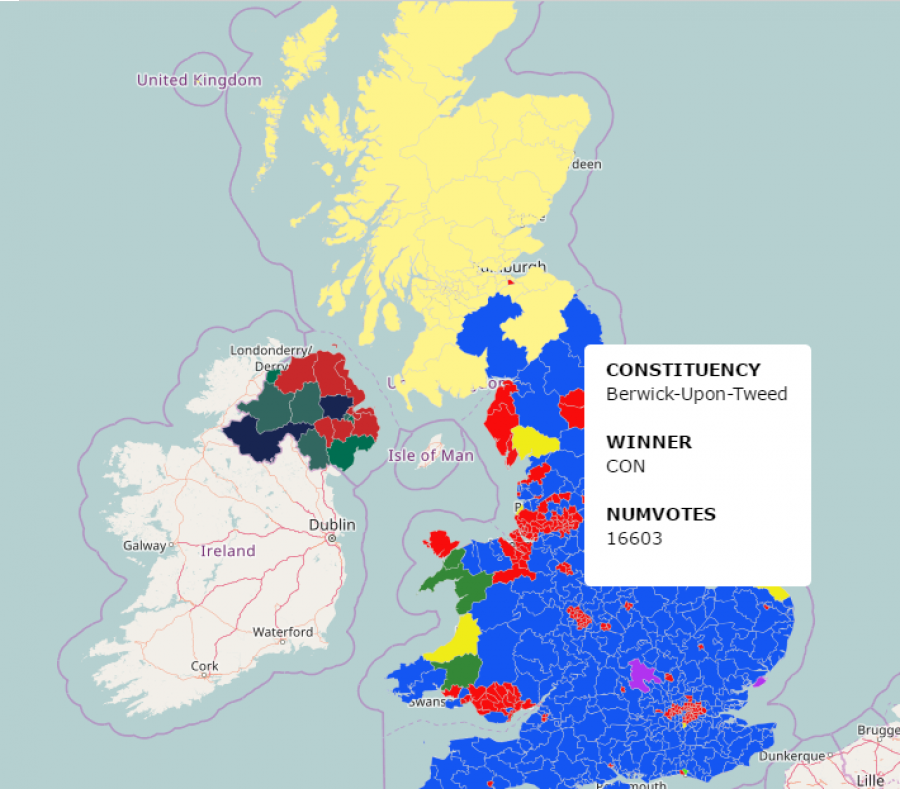
This will reload the layer with the new style and should look like below, well done you've got a predominance map.
Step 5 - Setup layer interactivity (optional)
Azimap has the capability to add client side interactivity to a map layer utilising UTFgrid. Just choose the data you want to show on hover and it will display on the map immediately.
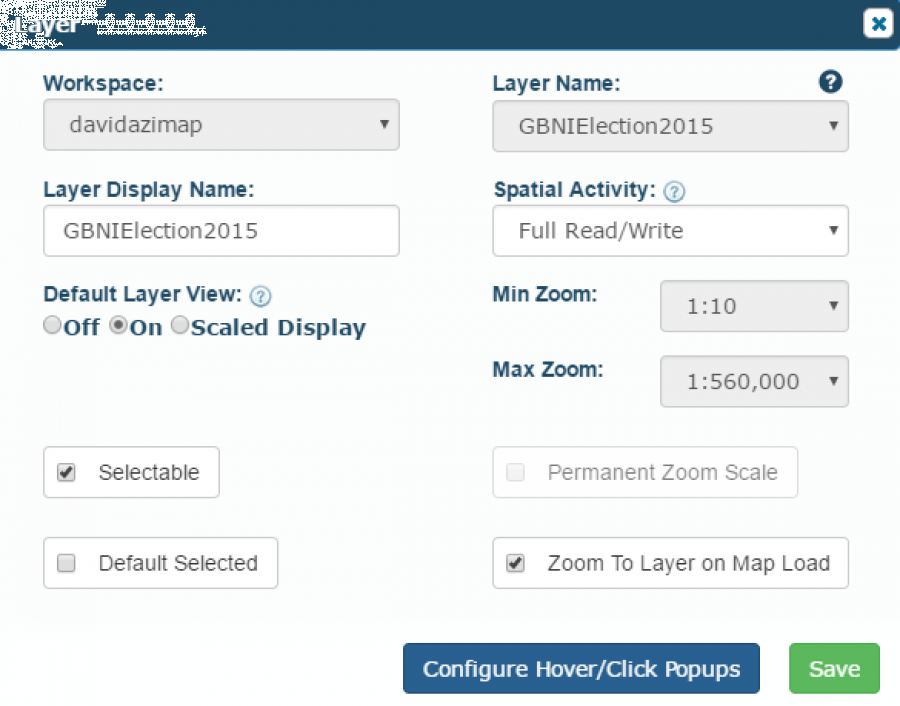
Select the edit map layer config button in the layer chooser control (the gear symbol)
This will open the map layer configuration control, for this example select 'Configure Hover / Click Pop Ups' button.
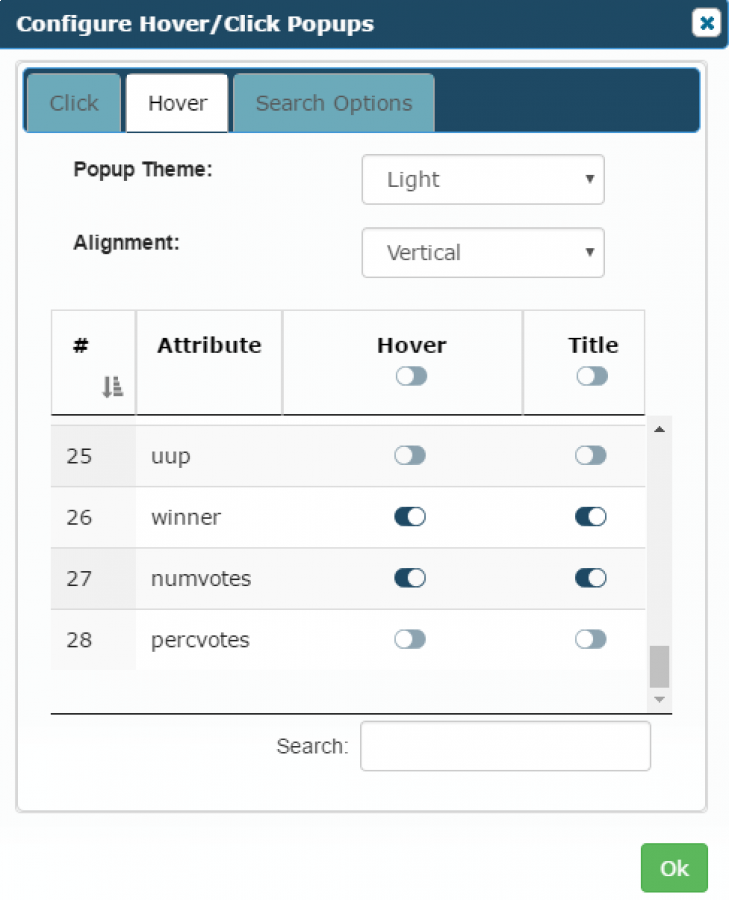
Select the "Hover" tab - here we can chooser the styling of our interactive popup (black theme/ white theme or data layout of horizontal or vertical)
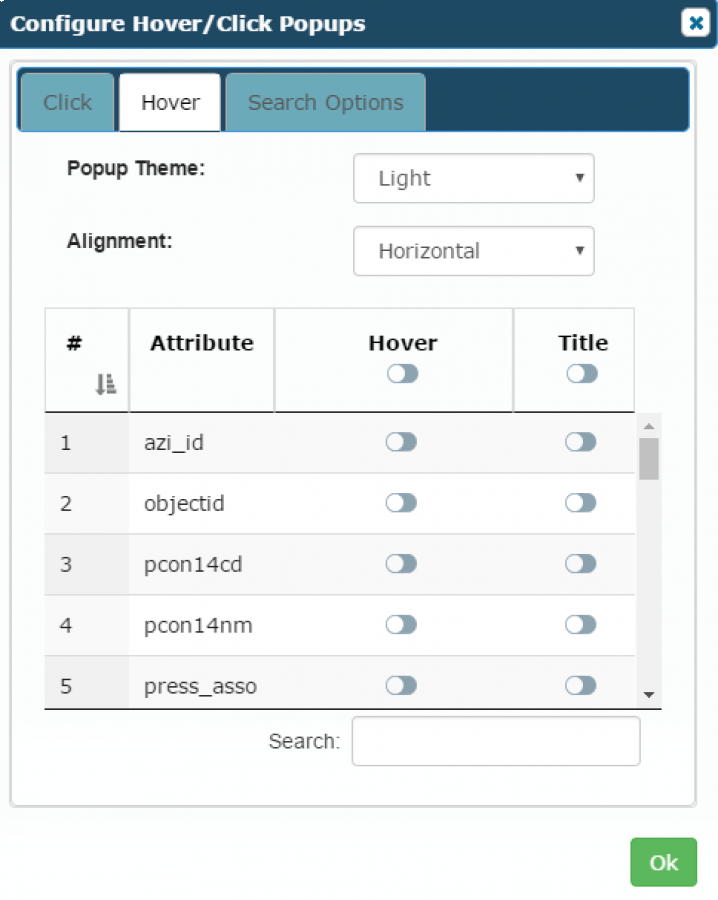
Choose the switch for the data you want to display in your interactive hover popup - I have chosen Constituency, Winner and NumVotes. Click OK and then Click SAVE
Now to see your new interactive popup, hover over any polygon.
If you have any questions or need any additional support do not hesitate to email support@azimap.com