


News
Home | News | Azimap Announces Major User Interface Changes
Azimap Announces Major User Interface Changes

The team at Azimap is delighted to announce some exciting new changes that are now available for all Azimap users!
Over the past few months, we have been working extremely hard to improve the user experience within Azimap and deliver significant improvements to the product's performance. The full site has had a complete redesign, from the home screen, map and dataset pages through to the actual map display; we have worked hard to produce a product that works better for you, the end-user.
As well as a host of visual changes, big changes have been taking place under the hood of Azimap with 100's of bug fixes and further code changes resulting in significant speed improvements across the product. In certain areas of the product, users will now notice that items load faster, menus display quicker, and information is more easily accessible, with a 400% improvement in some cases.
This latest release continues our commitment to provide our users with the most feature-rich and powerful web GIS available. Further details on the changes and new features included in the latest release include:
New Administration Features
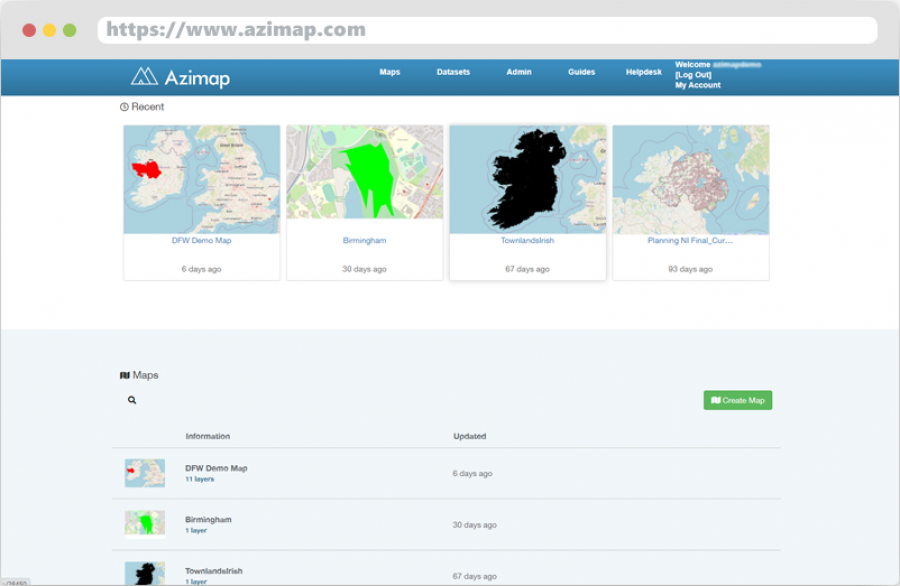
Find and access all of your maps and data in one place. The entire administration section has been updated and redesigned to allow you to find and access your maps and datasets quickly and easily. The new home screen now displays your most recent maps and datasets at the top of the page, allowing you to pick up where you left off. In conjunction with this, the maps and dataset pages have been redesigned to provide users with more information about their data on the main screen as well as enhanced search and speed improvements.
Map Creation Process
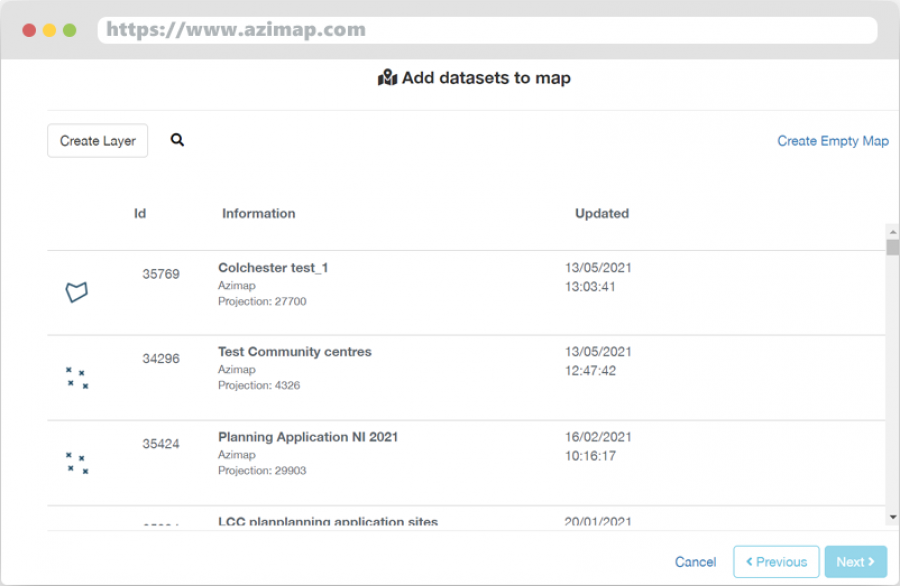
New streamlined workflow system for easy creation of maps. We have introduced a wizard system for creating maps to help guide all users through the process, enabling users to quickly create meaningful and useable maps. The wizard helps users add data to their map and will then guide users through the addition of tools and widgets on the map. Tools have been redesigned and grouped together to allow to easy addition of only the tools required for your map.
New Edit Data Page
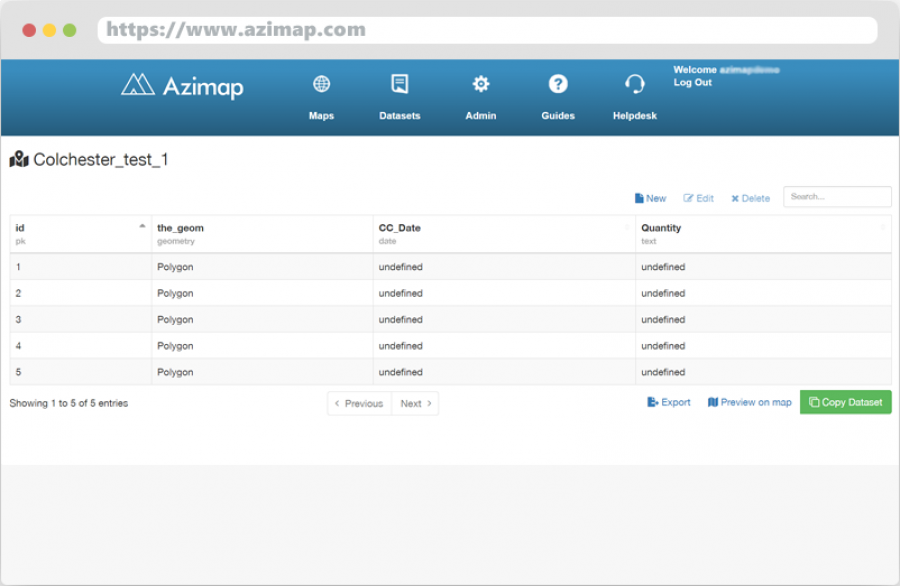
We have changed the way that data is edited, providing users with greater flexibility. It is now possible to create, edit and delete data in a tabular format without adding it to a map, with new datasets able to be previewed before creating them. It is also now easier to copy your datasets and export them in multiple formats, including CSV, SHP, TAB, KML and GEOJSON.
Analysis Wizard
The all-new analysis wizard will help all users to gain insights from their data. The wizard simplifies the data analysis process with the introductions of workflows to guide you through each step. The different analysis options have been grouped together with detailed explanations of what can be achieved with each, helping users to easily identify the type of analysis they want.
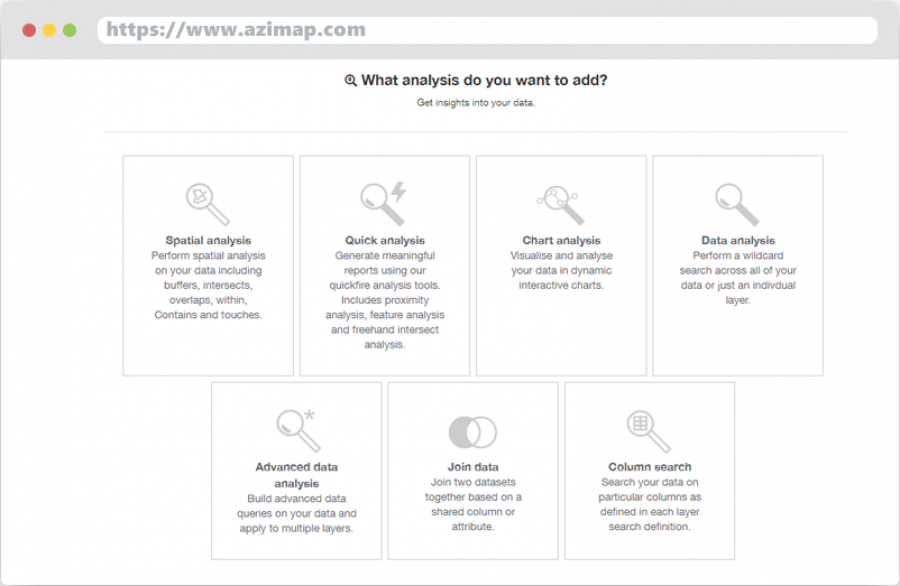
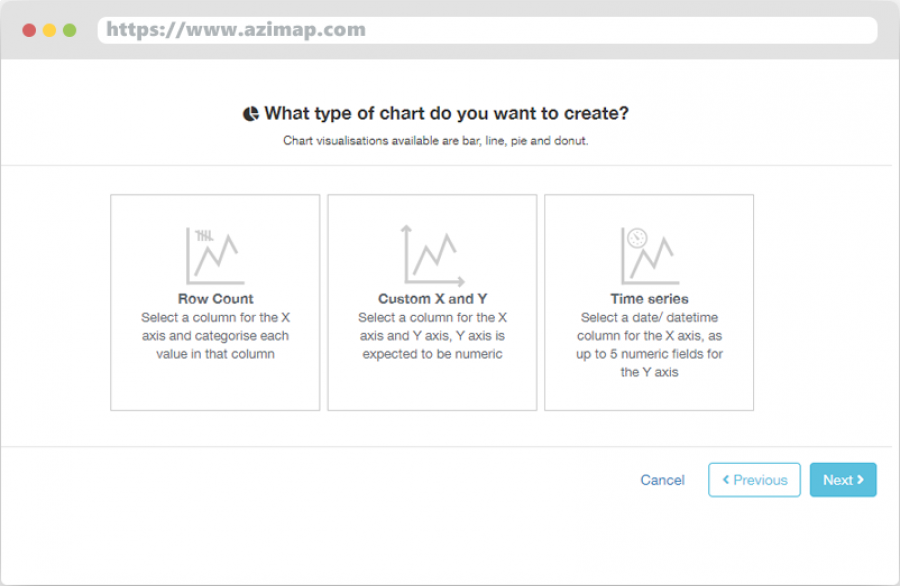
Chart Analysis
Create beautiful and insightful interactive charts directly from your data. Supporting bar, line and pie charts users are now able to create interactive charts that will filter/zoom the data on the map. There are three different types of charts that can be created. These are Row Count - display a count or instance of a specific record in your data, Custom - create a custom chart based on your data, Time Series - chart time-based data across different date and time ranges.
Experience
Would you like to experience our new user interface updates for yourself? They are available to try today by signing up for a 30 day free trial of Azimap professional.


