Spatial Analysis
This guide will teach you how to import two shape (zipped) files and how to perform spatial analysis.
Step 1 - Download Files
Step 2 - Click on the Maps tab on the global navigation and select Create New Map
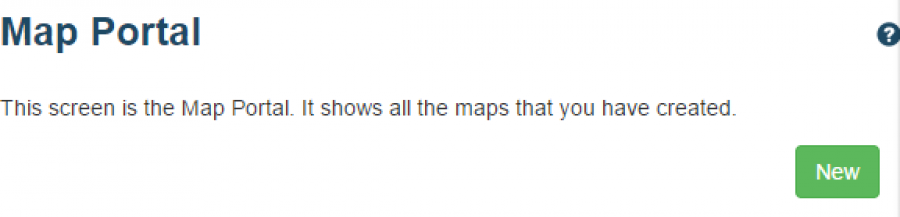
Name your new map and save.
Step 3 - Import Data and Add to Map
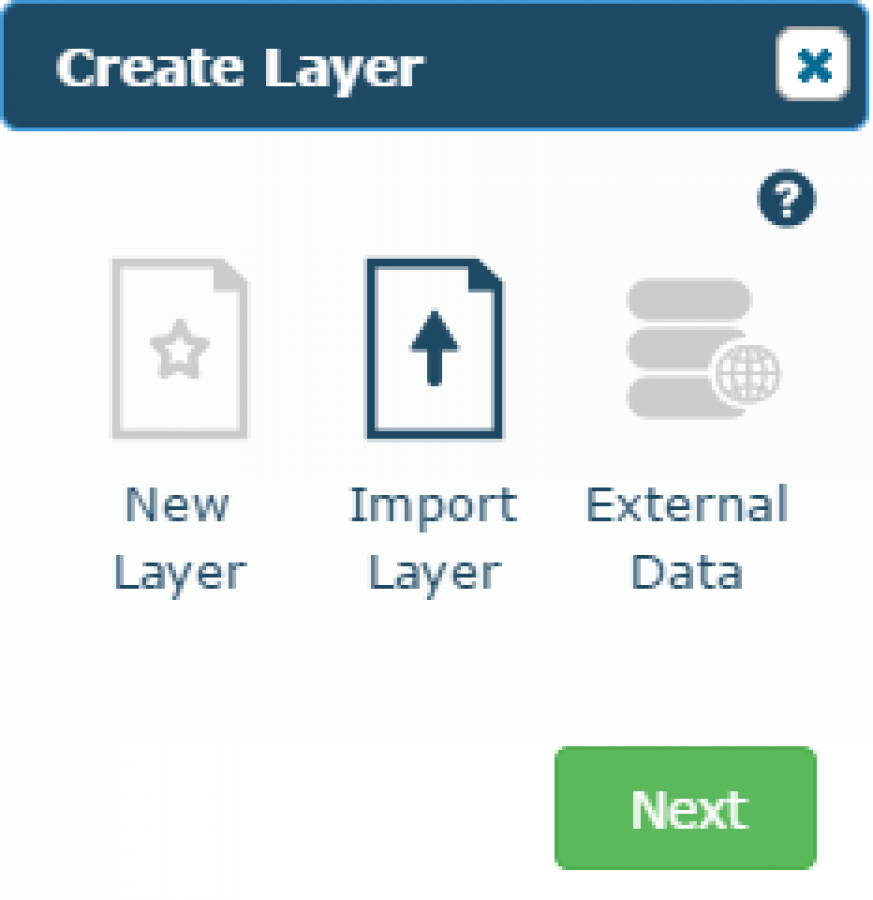
When you try to load a map without any layers attached you get the below window
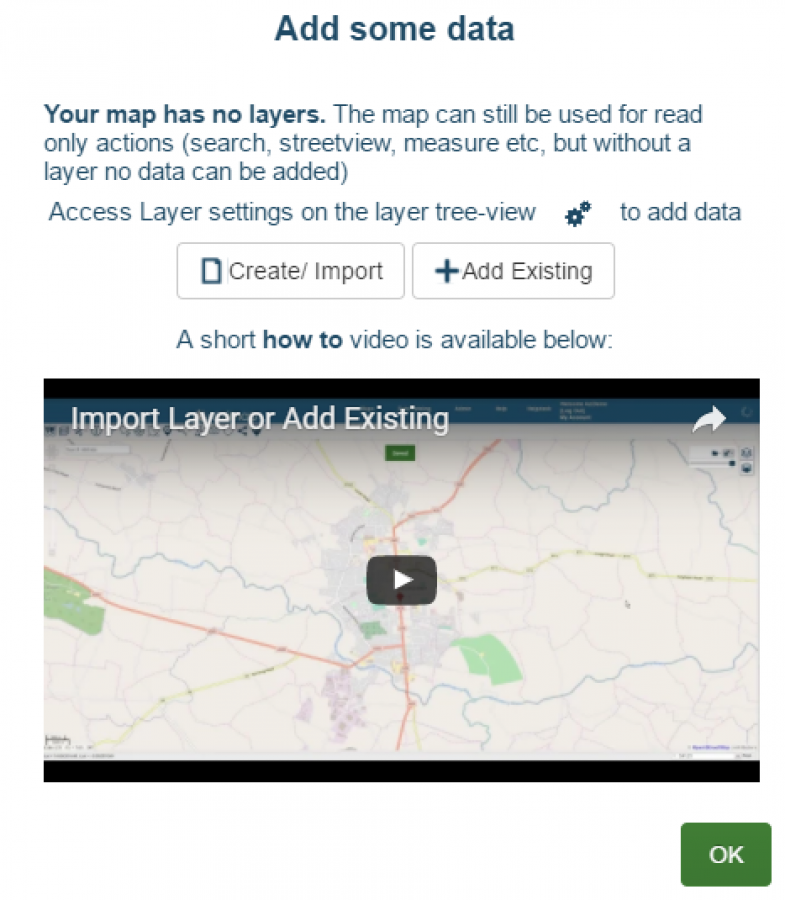
Select the create / import button, this is accessible on the map using the button on the layers tree view.
Select Import
Drag and drop to the DnD area the earlier downloaded zip files. It's important to highlight that Azimap supports zipped and non zipped files.
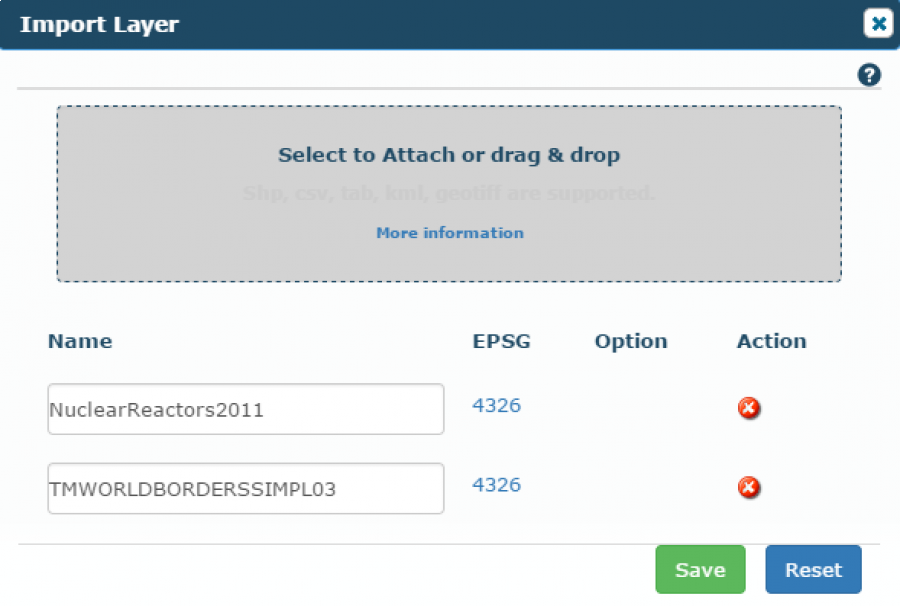
Select Save to import the layer, this may take a few seconds. The larger the dataset, the move time will be required to import the data, however the application will email the system administrator once the the data has been imported successfully.
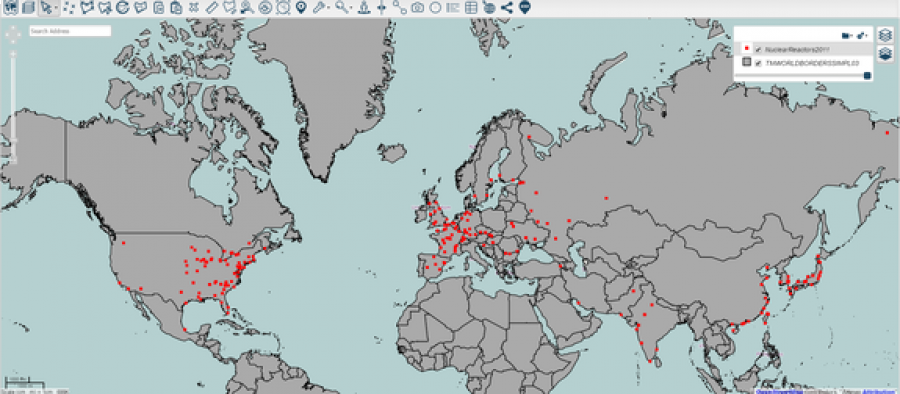
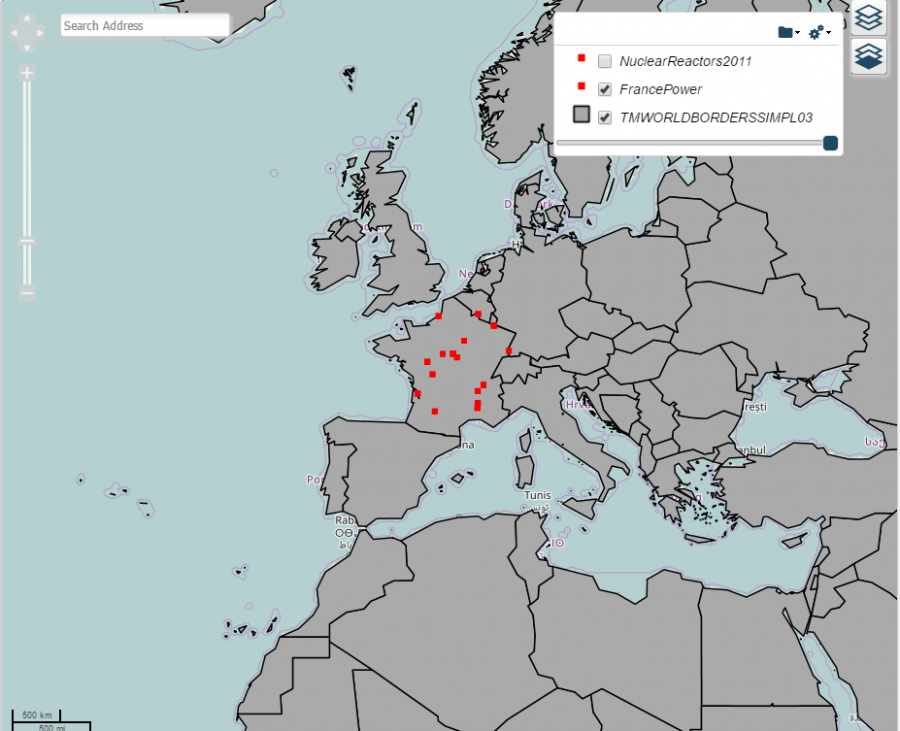
After successful import the map will load with the default styling of red squares and grey polygons.
Step 4 - Spatial Analysis
Select the spatial analysis tool, as seen below -
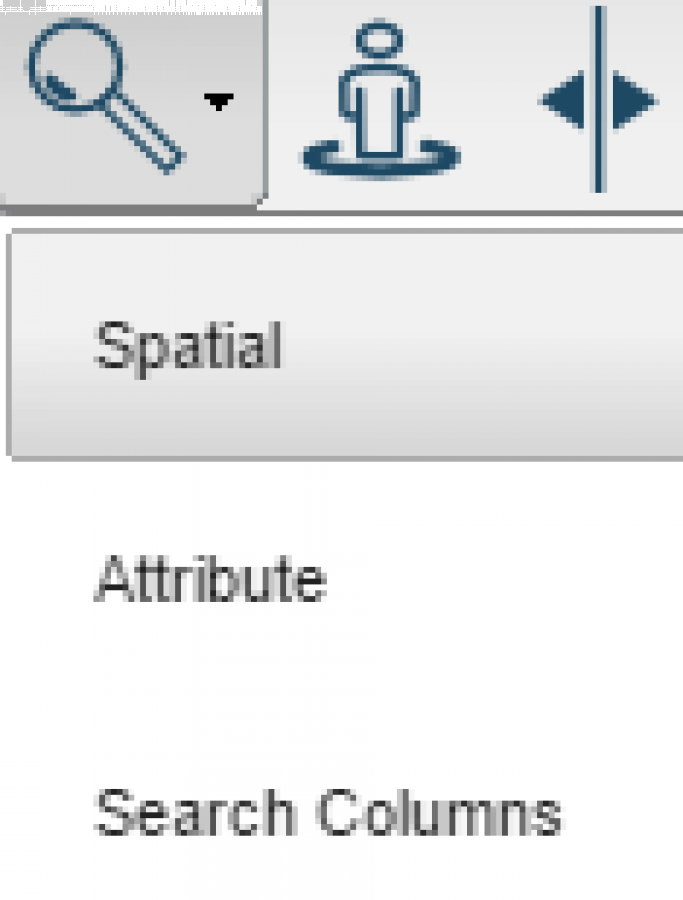
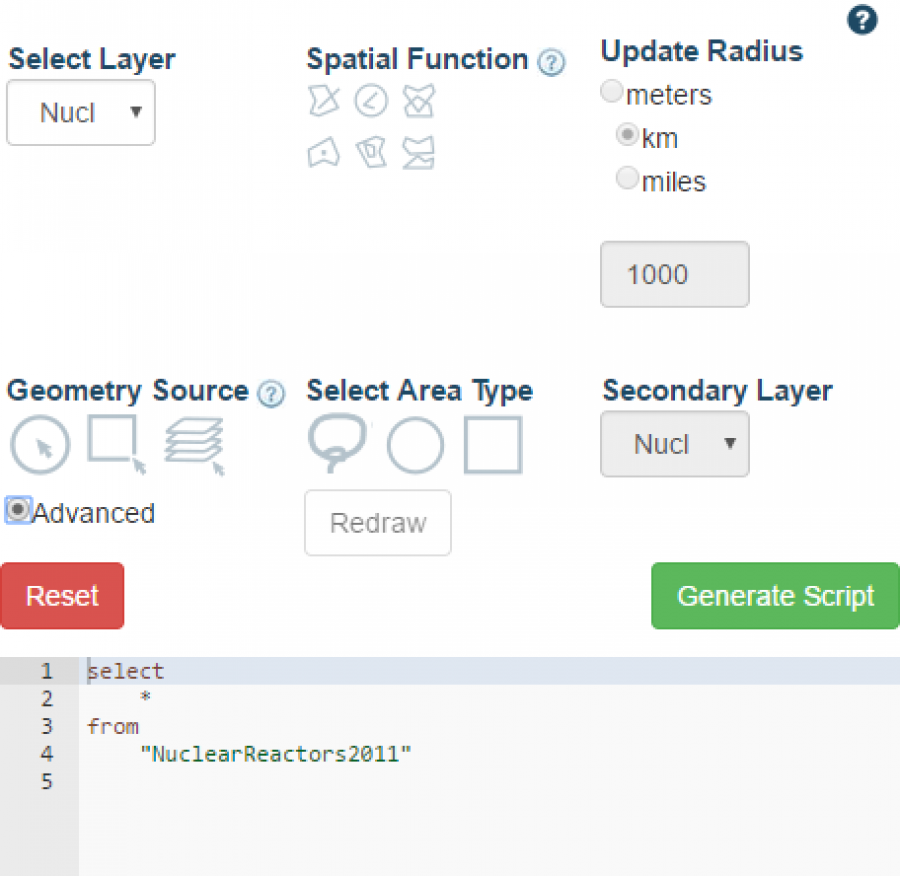
Upon selecting the spatial analysis tool, the spatial analysis wizard will slide out
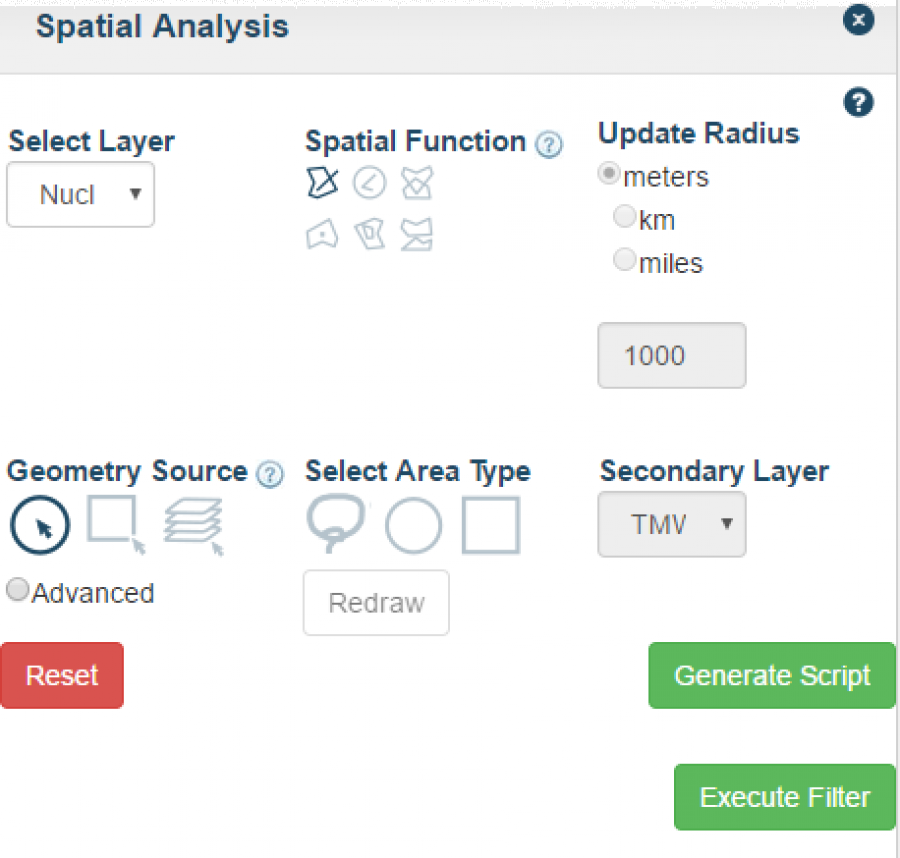
This is a powerful wizard with multiple functions
- Select Layer: Choose the layer from which to get results
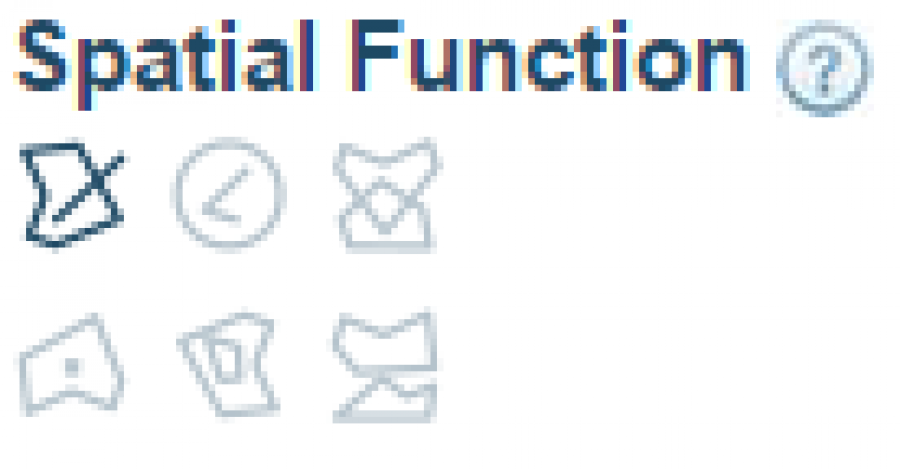
- Spatial function: There are six spatial functions to choose from -
- Intersects
 this will return a result if two geometries "spatially intersects in 2D"
 - Buffer
 this will return results within a given distance from the input geometry
 - Overlaps
 this will return result if the geometries share space, are of the same dimension but are not completely contained by each other
 - Within
 this will return results of the geometry A is completely inside geometry B
 - Contains
 this will return results if and only if no points of B lie in the exterior of A, and at least one point of the interior of B lies in the interior of A
 - Touches
 this will return a result if the geometries have at least one point in common, but their interiors do not intersects
- Intersects
Azimap uses Postgis for its spatial analysis. Other functions can be utilised if entered directly into the query window
Step 8: Advanced
- Update radius: distance for buffer (enabled on buffer analysis) option m, km and miles
- Geometry source

- Select a feature
- Select multiple features
Compare layers
- Select area type: enabled on multiple feature select
- Lasso select

- Circle select
- Box select

Secondary layer: enabled on compare layer select. When comparing layers, choose the secondary layer to compare
Step 5 - Intersects
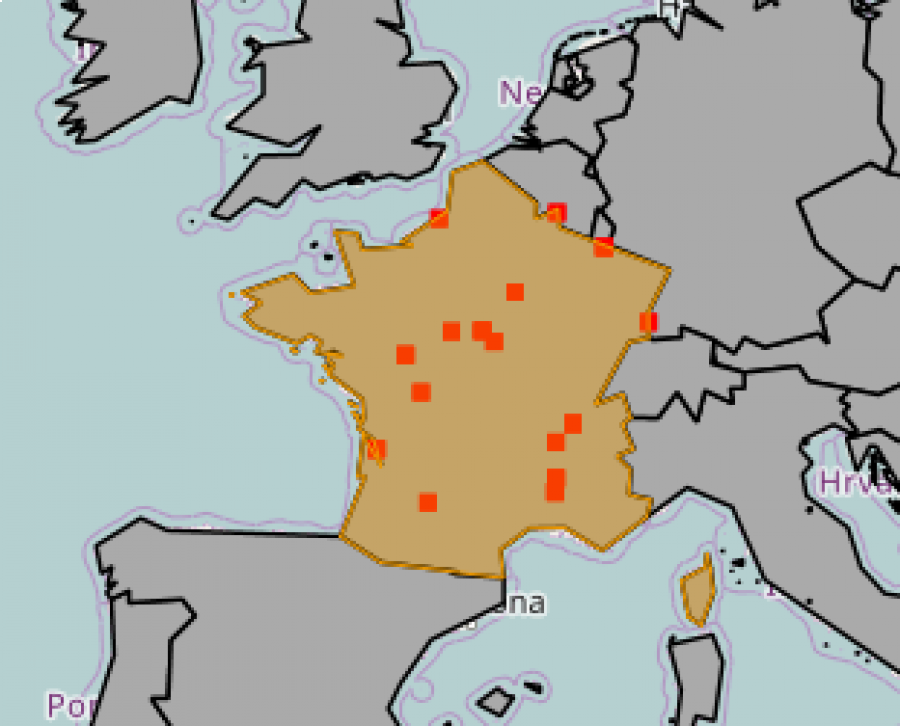
Lets use the spatial search tool to select all of the nuclear power stations in France
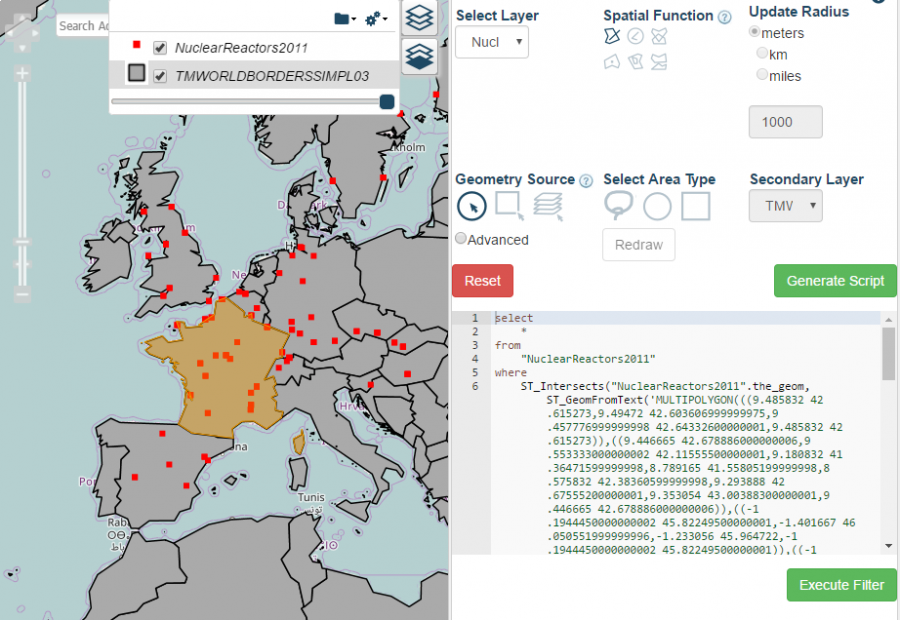
- Click on France to select the country polygon (it should highlight)
- Select output layer (NuclearReactors2011) in select layer drop down
- Select the intersects tools in the spatial function options
- Select the select feature tool
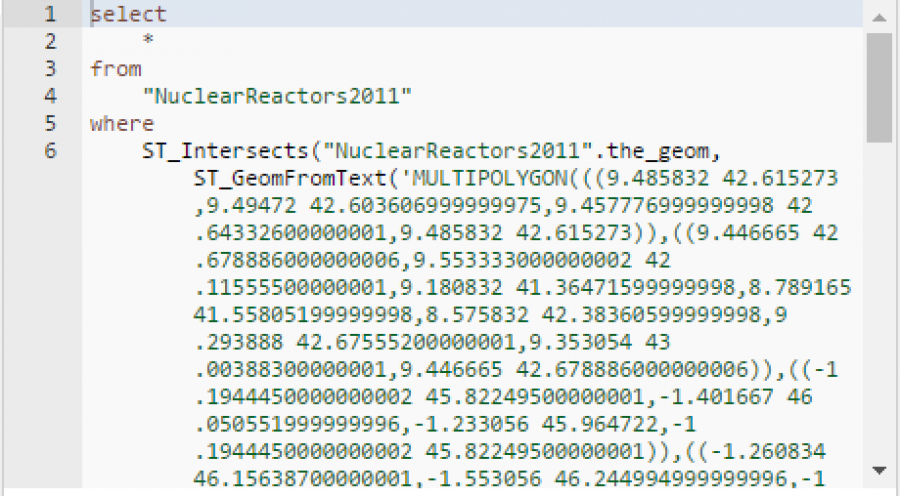
- Select generate script - this will generate the required SQL to output all the nuclear power stations that intersects with the France polygon
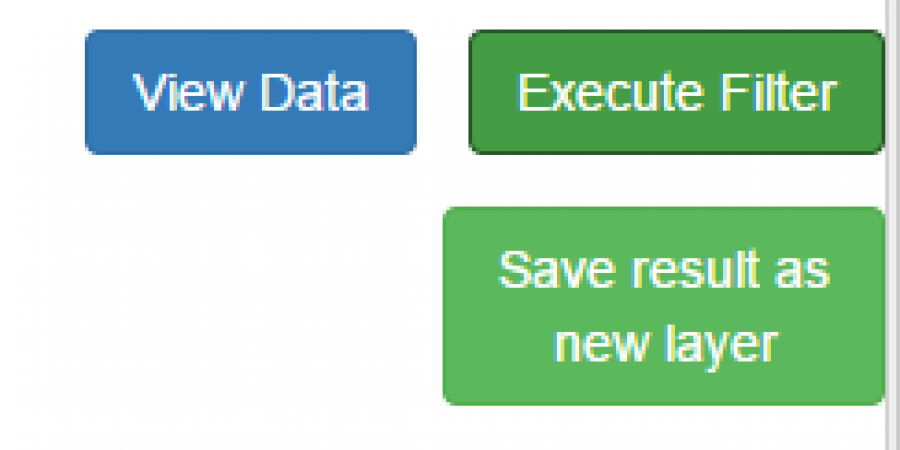
- Select 'Execute Filter' to see your results
You can view the results in tabular format by selecting 'View Data'
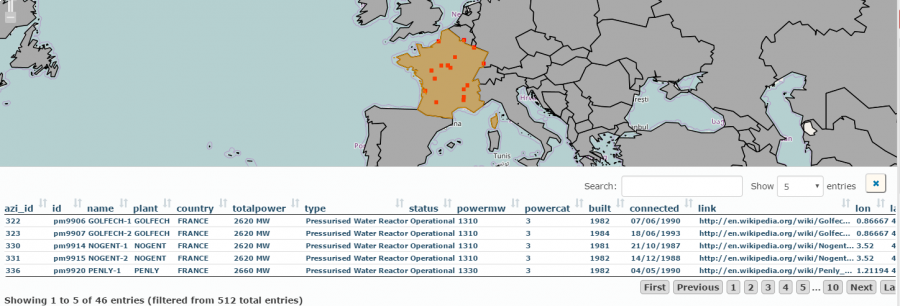
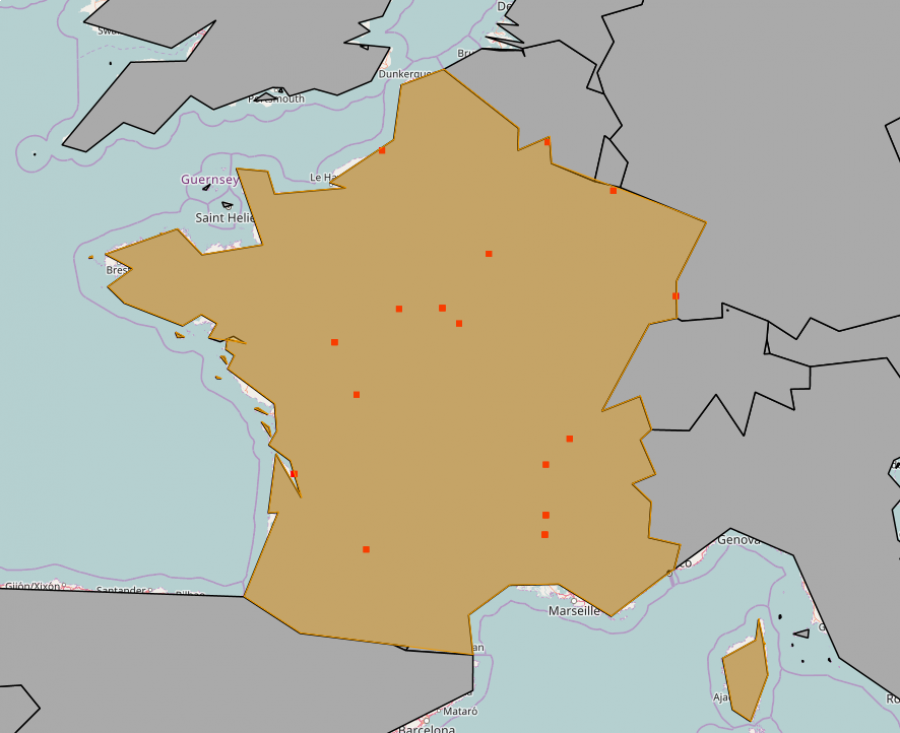
View data shows the filtered 46 Power Stations in France
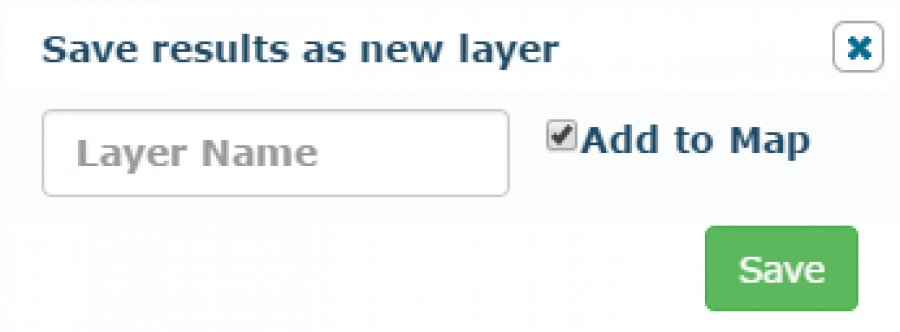
The 'Save results as new layer' allows you to add the layer to the map and into your data catalogue for future use.
When added to the map if should look like the below with the new 'FrancePower' layer added
Step 6 - Overlaps, Within, Contains, Touches
To perform any of the above spatial analysis just follow the process in Step 5 but choose you applicable option from the Spatial Function section.
Step 7: Buffer Select
Creating selection buffers is slightly different - you must select the radius of your buffer after choosing the 'buffer select' function.
Process the query as per step 5 only this time set a buffer radius (will be enabled if 'buffer select' is chosen)
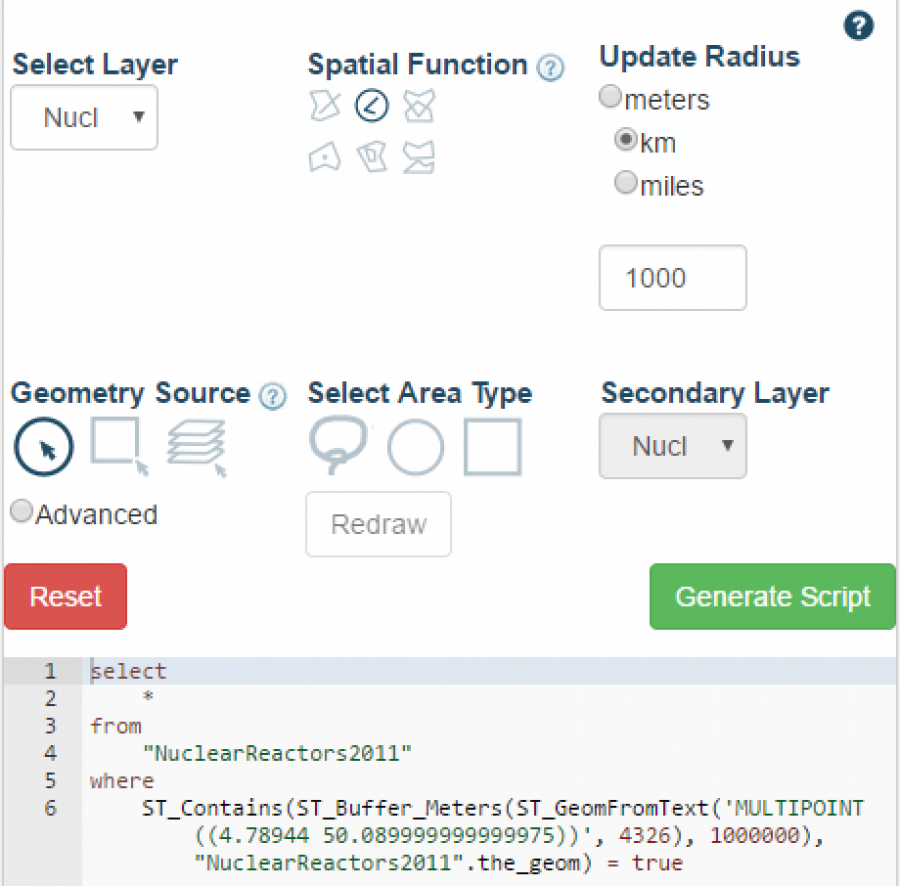
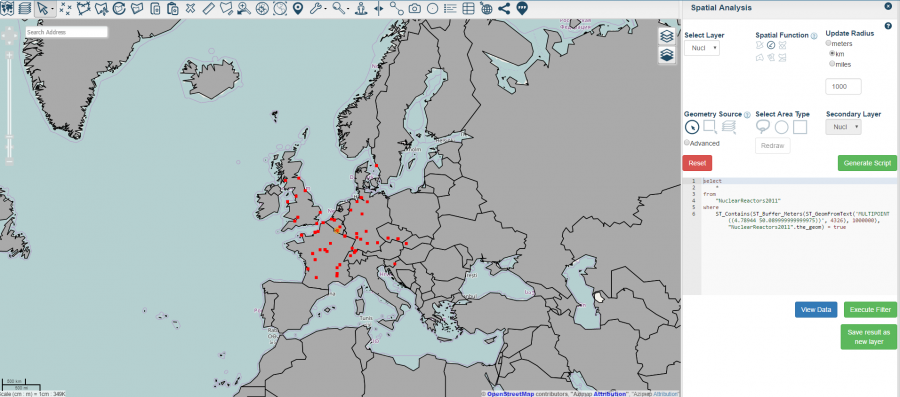
In this query I have selected a random power station in France and set a 1000km buffer zone.
This results in only the resulting answers being shown on the map.
Step 8 - Advanced Spatial Features
The wizard creates query SQL for you however if you know SQL syntax you can write your own advanced select queries by either editing the output of the wizard or choosing the advanced radio button.
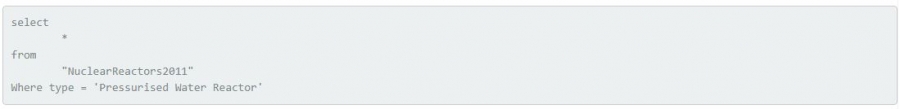
Note: Strings should be surrounded by single quotes, double quotes are used by us to signify table and column names.
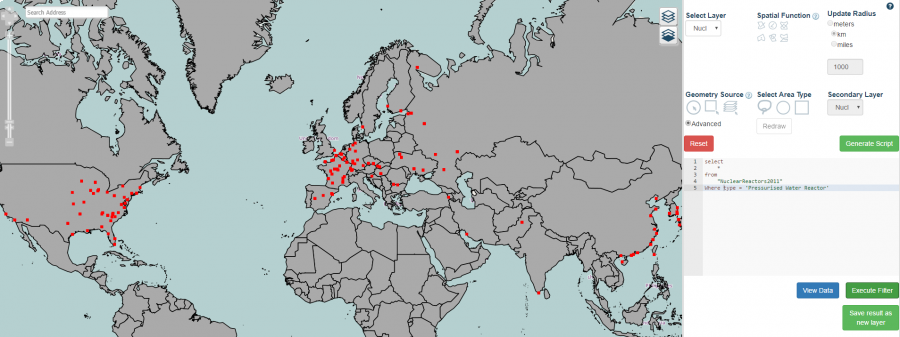
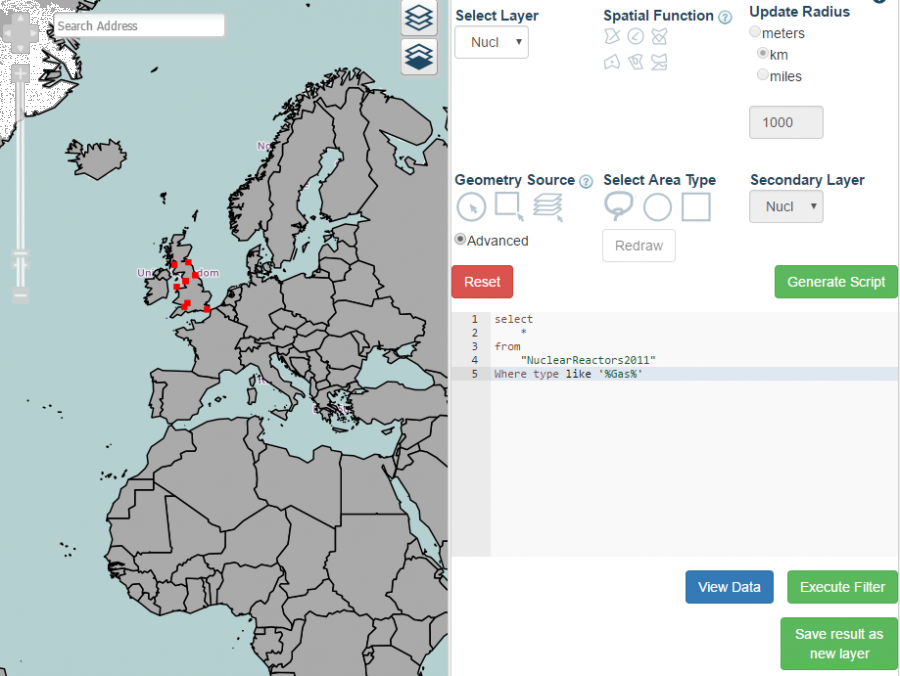
The SQL query box can now be typed into - to search for Reactors of type 'Pressurised Water'.
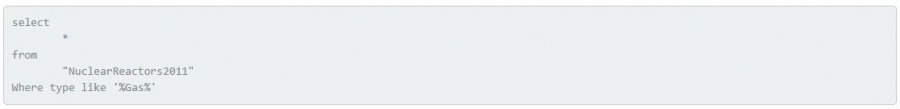
or for Reactors that are gas cooled
We can combine wizard generated queries with our own amendments.
Generate the Intersects Query from Set 5
The results in the below filtered dataset.
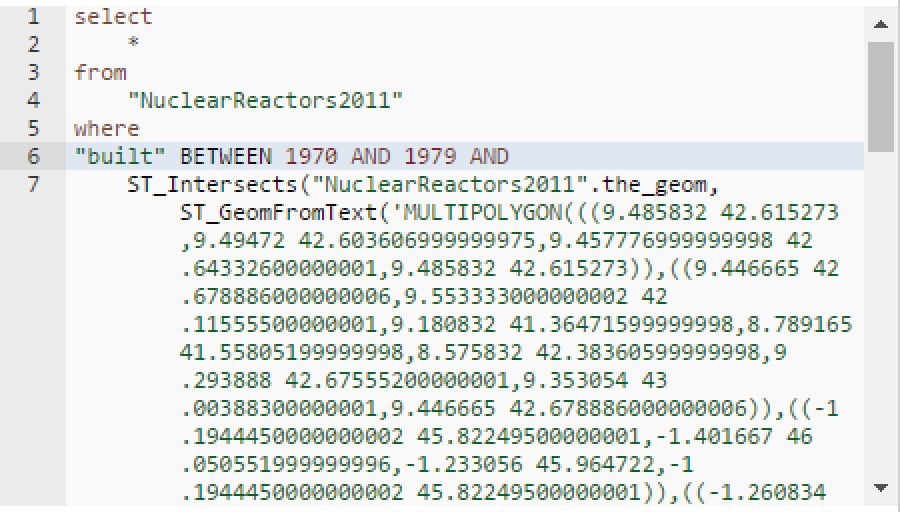
Let amend the query by adding year of construction between 1970 and 1979 inclusive. For this example we will utilise the SQL between command which is inclusive.
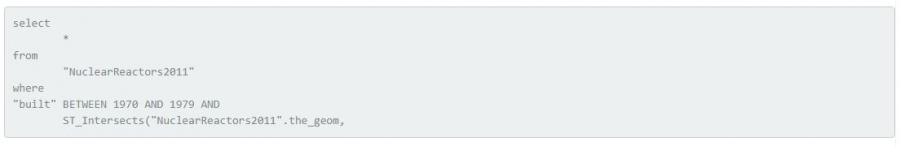
We have added a new line into the wizard generated query creating a new 1st WHERE clause and placing the spatial portion after an AND clause
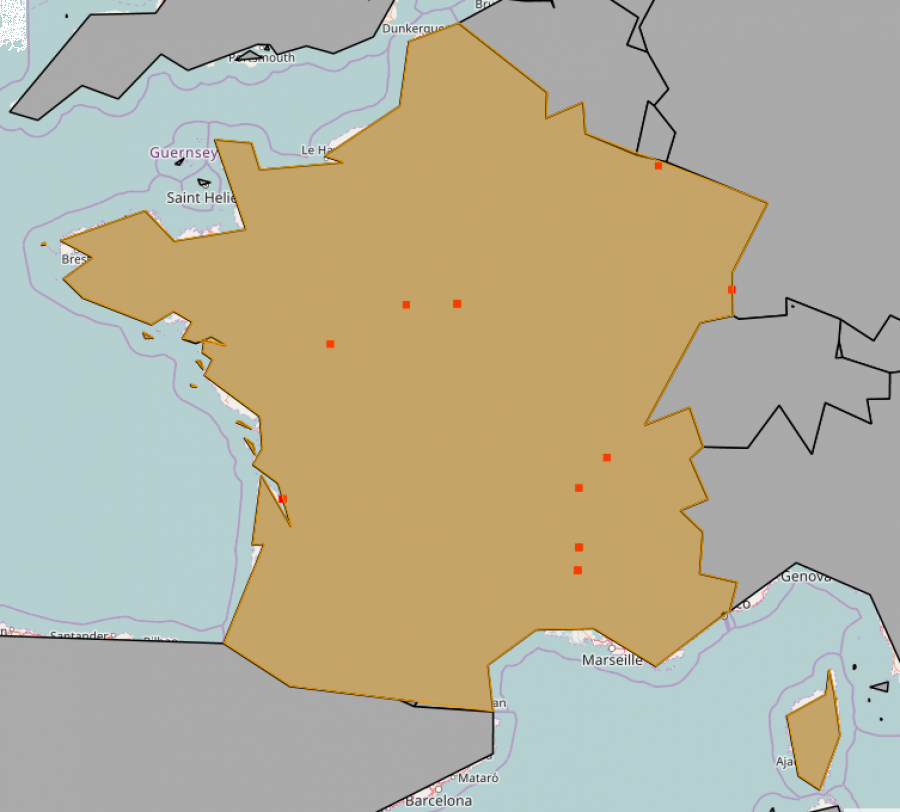
This results in the more filtered dataset showing Rectors built in the 1970's
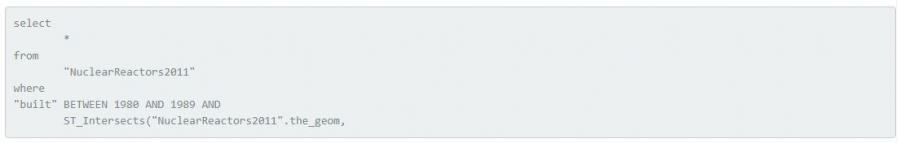
Lets check the 1980's
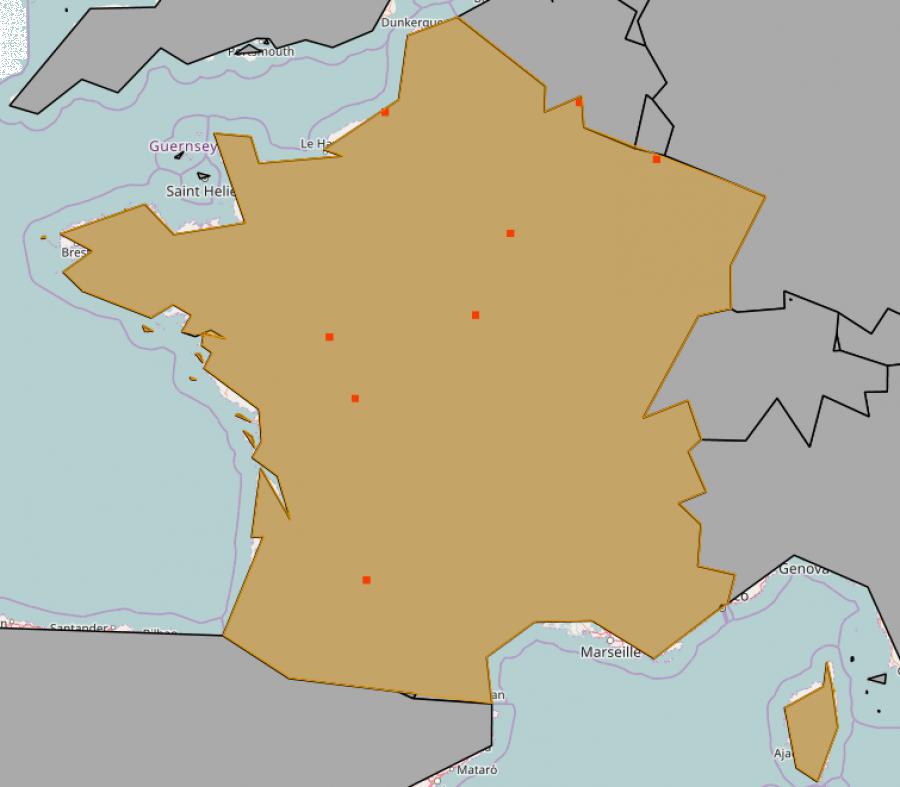
Lots of building going in France in the 1970s and 1980s.
If you have any questions or need any additional support do not hesitate to email support@azimap.com