


Examining Ireland's Housing Crisis
Over the past 12 months in Ireland, one topic that has continued to dominate the headlines is that is of the housing crisis.
Rising house prices, growing population and a shortage of available social housing has meant people are being squeezed out of the property market, which has resulted in homelessness rising by 30%. But how bad is the housing crisis?
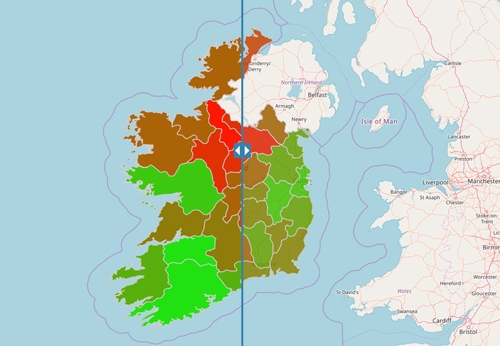
Our latest community map, created by Ruari O’Neill (Senior Software Developer) from Mallon Technology investigates the housing crisis. Using data from open sourcesDepartment of Housing Homeless Reportand Central Statistics Office Ruari has digitised the latest official statistics by splitting the data across multiple map layers to make it possible to quickly visualise the extent of the homelessness.
By default, the map displays the number of registered homeless adults as of October 2017, by county vs the number of vacant houses/flats by county. Using the swipe tool, uses can focus on the counties where homelessness and vacant properties have become an issue. For example; Dublin has the highest number of homeless adults but also has the highest rate of vacant properties. The map also features a layer of vacant houses/flats from the previous release of official statistics. By comparing this layer against the current figures it can be seen that since 2011, the housing crisis has only gotten worse for the vast majority of counties across the country.
This map serves to highlight the important role of Open Source Data has in our society and offers charities and governmental departments access to a visual representation of data to make informed decisions.
You might also like
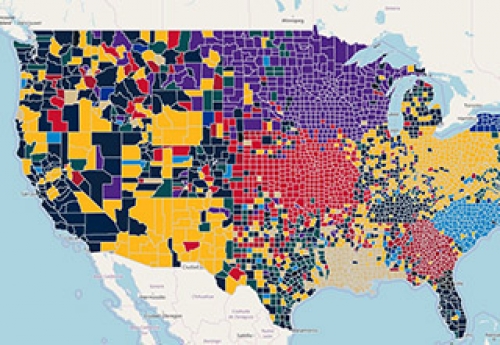
2017-2018 Top Google Searched NFL Playoff Teams By US County
Improving Interaction & visualisation of Leading News Stories
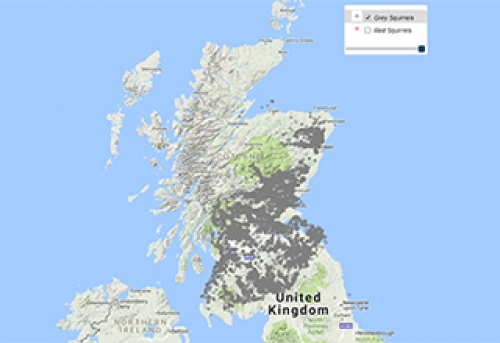
Squirrel Sightings Scotland


