


News
Home | News | Wild Fire Investigation Open Source Data and Software
Wild Fire Investigation Open Source Data and Software

2017 has seen many wildfires rage across the Irish countryside, with a significant number of these receiving much media attention for the devastation they have caused to rural environments. A large number of these wildfires have occurred in upland areas in counties such as Wicklow, Galway, Kerry and Donegal. Furthermore, many of these wildfires seem to have taken place in Spring to early Summer of this year, a period which coincided with a relatively dry season in Ireland which exasperated the situation. It created ideal conditions for these fires to continue burning and become uncontrollable.
It was at this time when our key partner Mallon Technology decided to carry out a study to identify burnt areas across all of the Republic of Ireland using GIS and Remote Sensing techniques. This was to be achieved using open source data and software. One reason for using open source data was the sheer number and scale of fire events occurring at this time. If the data had to be acquired and paid for, the cost would’ve grown exponentially to the point where the investigation could not be carried out.
Another reason for this decision was the quality of open source data available. The imagery that was sourced for this project was predominantly Sentinel-2 imagery as well as Landsat-8. Sentinel-2 is an ESA imaging satellite, which currently has 2 satellites in its constellation. The imagery from the newest satellite, Sentinel-2B, is just coming on board now. With the full constellation, the revisit time for imagery is approximately 2-3 days at mid-latitudes which is a big advantage when it comes to this type of investigation. However, at the time the research was undertaken, Sentinel-2A was the only operational satellite, with a revisit time of approximately 6 days over Ireland. Often with imagery for Ireland, the area of interest is fully or partially hidden by cloud cover. The high frequency of Sentinel-2 imagery increases the chances of useful cloud-free or partially cloud-free data being collected for burn scars across Ireland.
QGIS was selected as the software to be used for the imagery analysis. There are a number of reasons for this. Other than being open source, this software has become increasingly powerful with each update and additional plugins available. All of the remote sensing and GIS work could be done with a single platform. It also has a vast online community which provides help with solutions to problems as well as explanations of the different plugins and what they can achieve.
Sentinel Playground
In order to determine what imagery is available for a specific area, sentinel playground is a great tool to visually identify what imagery needs to be downloaded (http://apps.sentinel-hub.com/sentinel-playground/). This web portal shows the imagery available for a given area based on user input (date range, cloud cover) as well as previews of the imagery, Figure 1.
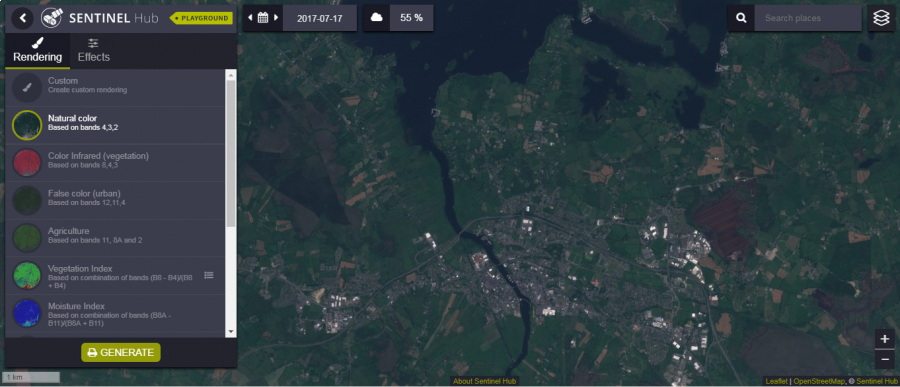
Figure 1 - Sentinel Hub Playground
There are also settings on the left hand side which allow you to view the imagery with certain band combinations which are commonly used. One of these, SWIR, is a very important tool in identifying the burnt areas created by wildfires. An example of this is shown below, Figure 2. This area in Cloosh Valley, Co. Galway, was affected by a wildfire in May. The area in brown shows the affected area.
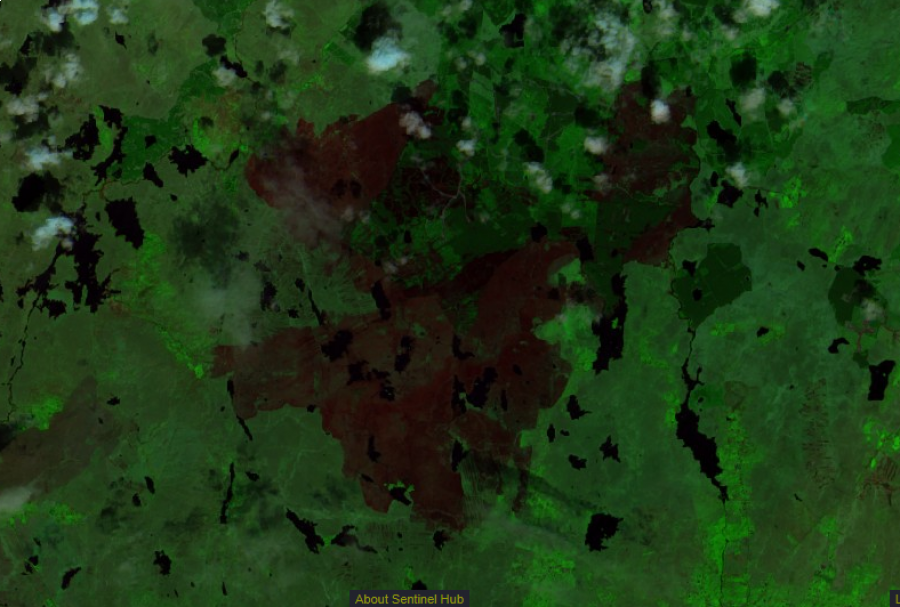
Figure 2 - SWIR Image of Wildfire in Galway
Another band combination which can show up burnt areas is Moisture Index. A moisture index image is created using the following formula for Sentinel-2 data: (B8A – B11)/(B8a + B11) (Figure 3). The result below shows the burnt area as an area which has little to no moisture because the vegetation and shrubbery which held water has now mostly been burnt and decomposed.
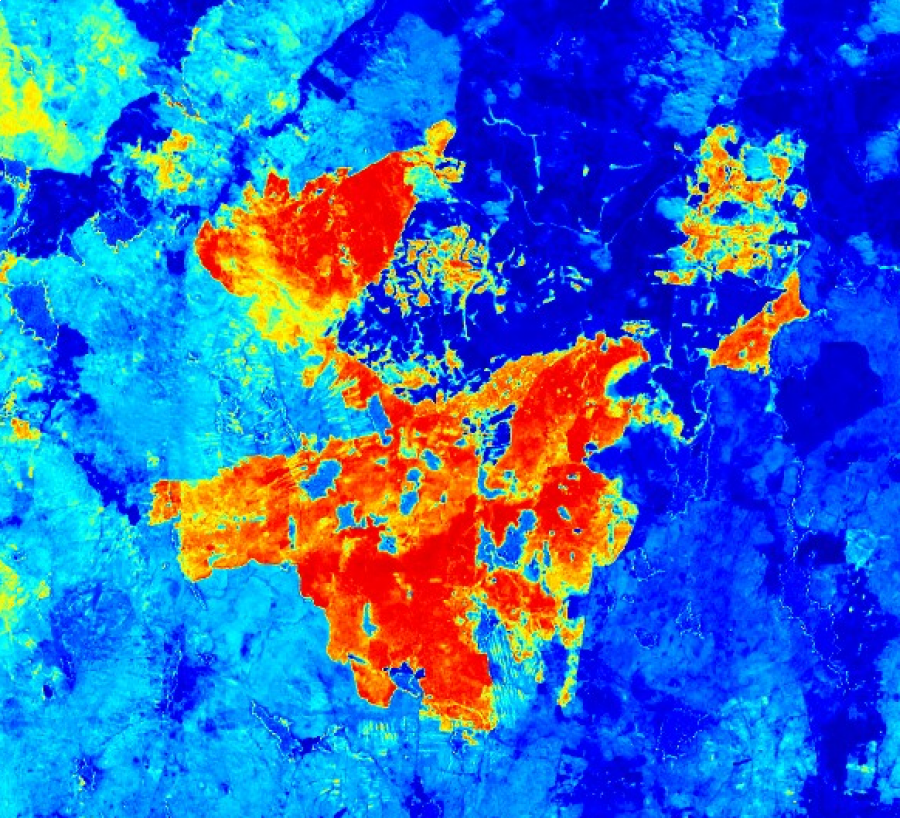
Figure 3 - Moisture Index of Wildfire (Wildfire in red, orange)
QGIS
Once the imagery required was identified, the ‘Semi-Automatic Classification Plugin’ (SACP) was used to directly download and pre-process the imagery in QGIS. This plugin allows you to select the bands required. There are numerous visible and infra-red bands available to download but if you download them all you increase the file size significantly. There are certain bands that are important for this investigation (particularly bands 3, 8, 8A, 11 and 12), so these were singled out and downloaded.
Data Reduction
The next stage is to carry out some simple raster procedures to remove some of the data from the imagery. Such data removal and reduction through masking and other techniques cuts down on much spectral ambiguity in relation to the delineation of burn scars. For example, waterbodies and cloud cover can cause much spectral confusion with regards to burnt areas so these can be removed from the dataset. A vector map of Ireland can also be used to remove areas outside of the land mass of Ireland. An example of this is below (Figure 4).
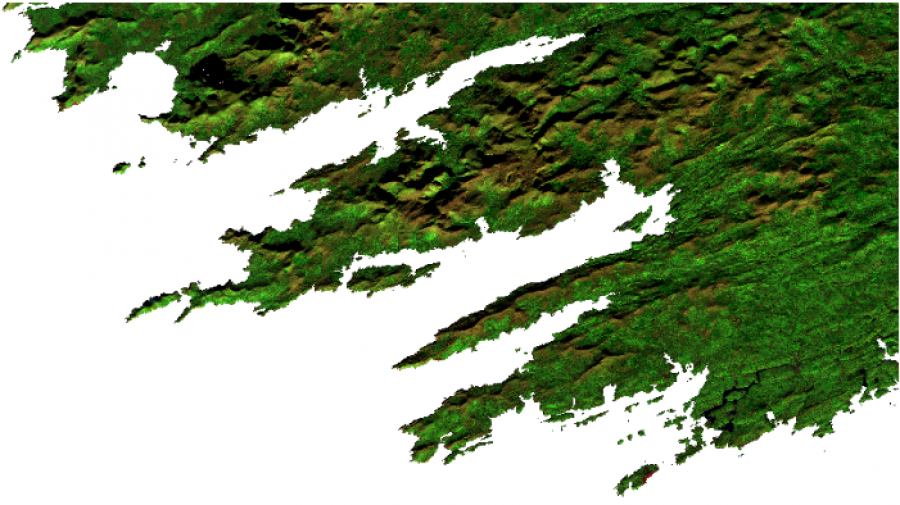
Figure 4 - Mask applied to imagery to remove unnecessary water data
A cloud and water mask can be created by calculating a Modified Normalised Difference Water Index (MNDWI). In terms of Sentinel-2, MNDWI is calculated using the following formula;
(Band 3 – Band 11)/(Band 3 + Band 11)
Where band 3 is the Green visible band and band 11 is the Short Wave Infra-Red 1 (SWIR1)
This results in an image such as below, Figure 5, which shows the areas of cloud and water from light grey to white.
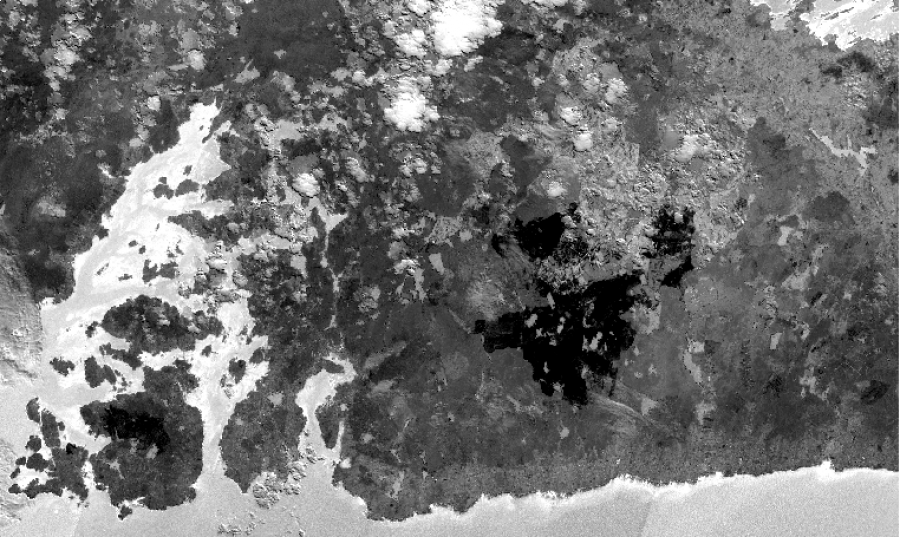
Figure 5 - Water / Cloud mask created to remove features from image
By determining the threshold at which clouds and water are identified in this image, a resulting Boolean raster can be created which is used to “cookie cut” the clouds and lakes out of the image. Figure 6 below shows the result of an image which has had a cloud and water mask applied to it. All the areas in white are areas of either cloud or water which have been removed, and the remaining greyscale pixels are the areas which can be investigated further.
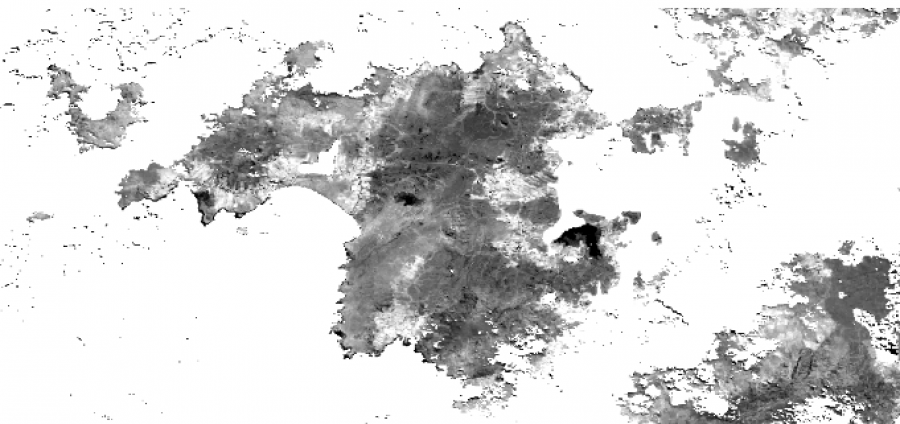
Figure 6 - Image with cloud and water areas removed from imagery
Identifying Burnt Areas
Once the unnecessary data is removed, identifying the burnt areas is the next step. This can be done by formulating another band calculation to determine the Normalised Burn Ratio (NBR). This is defined as;
(NIR – SWIR)/(NIR + SWIR)
Where NIR = Near Infrared and SWIR = Short Wave Infrared
QGIS has a raster calculator which can run this process quickly and produce the result as a new image which can be saved. An example of the result of this calculation can be seen below, Figure 7. This calculation produces very low DN values for pixels which are burnt. In this case, the SE of the island has a burn scar which is easily identifiable from this image.
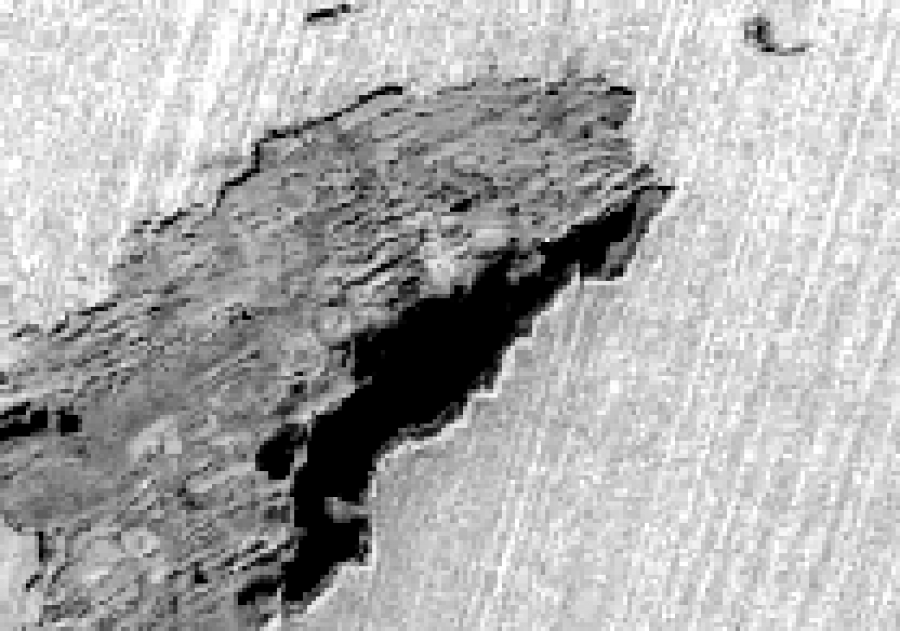
Figure 7 - NBR Image highlights areas of burn (dark areas)
The next step is to try to determine a threshold of DN values in the image which includes and isolates the burnt areas, excluding (as best as possible) all other non-burnt features in the image. Further processing of the values defined within this threshold can also provide an indication of levels of burn severity within the scar(s). The result of this step is below, which shows an indication of the severity of the burn in different areas (dark red represents the most severely burnt areas and yellow represents the least severely burnt areas) (Figure 8).
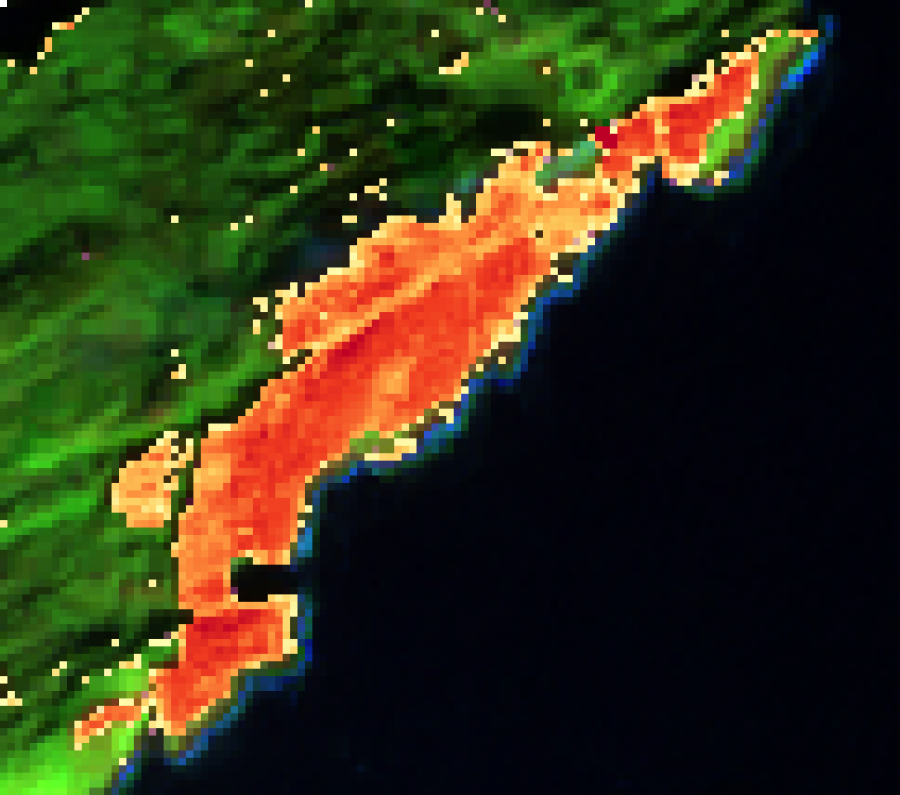
Figure 8 - Burn area categorised by severity of burn
Extracting Burn Scars
In order to extract the burn scars, the raster data needs to be converted to a vector dataset. This is done by using the NBR image talked about previously. The image is cleaned and filtered to remove as many incorrectly classified pixels and outliers as possible until you are confident the pixels remaining represent burnt pixels. The vectorisation process can then be run. QGIS has a conversion tool which will input raster data and convert it to a vector layer, Figure 9. Once the scars are in vector format, further analysis can be done including measuring the area affected and comparing it against other data layers.
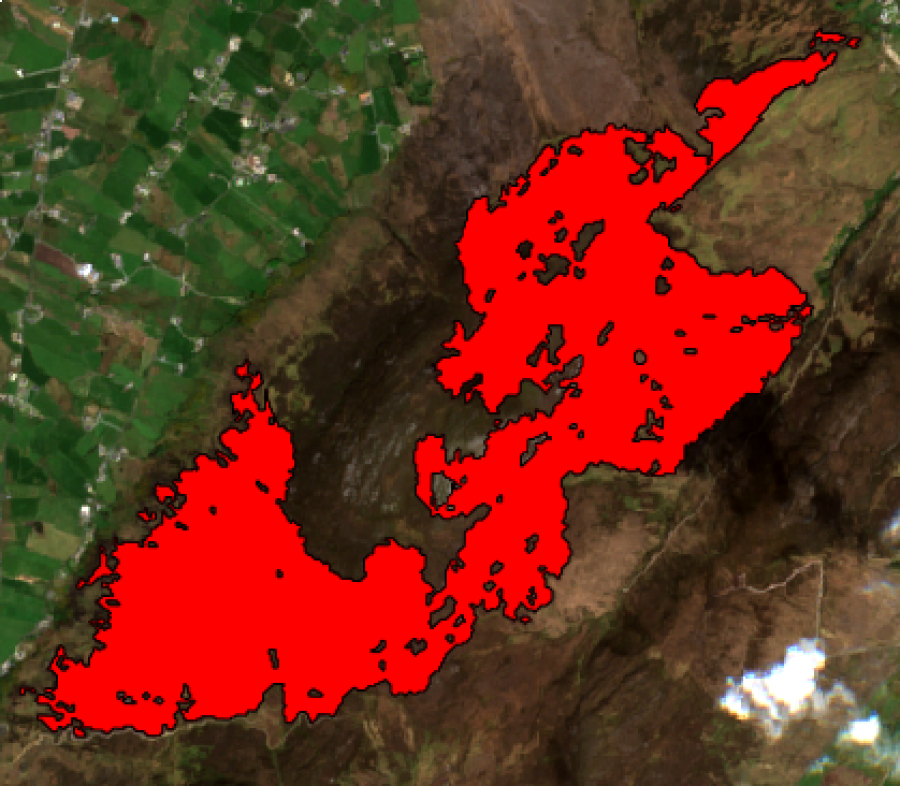
Figure 9 - Vector polygon of burn scar in Donegal
Azimap
The resulting data from these steps can then be uploaded onto Azimap, an online GIS platform. By using this platform, the results of the study can be shared to other users who can view the layers alongside base layers such as Open Street Map or Google Maps. The burn scar layer was uploaded, as well as the burn severity shapefile. Other layers uploaded included the MODIS and VIIRS datasets. MODIS, short for MODerate resolution Imaging Spectroradiometer, is a sensor used to identify fire incidents across the world. VIIRS, short for Visible Infrared Imaging Radiometer Suite, can also detect fire occurrences but with a higher resolution than MODIS.
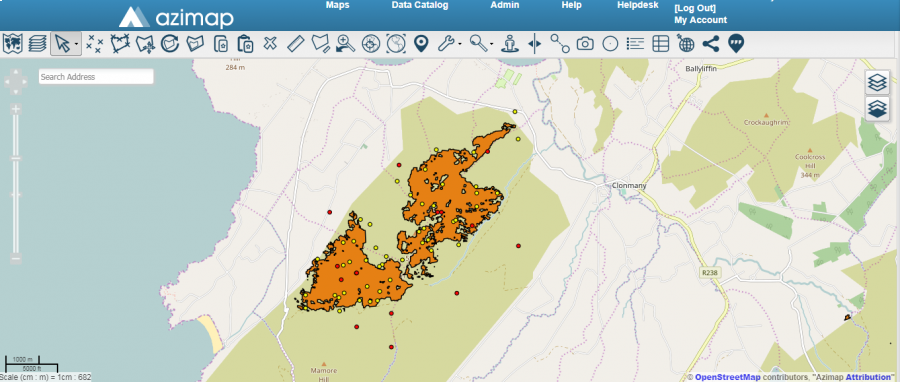
Figure 10 - Burn scar polygon in Azimap
Figure 10 shows a burn scar near Buncrana in County Donegal. The orange polygon is the scar, the yellow points are from VIIRS and red points from MODIS. It can be seen from this map the difference in accuracy of each sensor, as well as the improved data that the Sentinel data can produce for wildfires. The sensors are good to identify possible fire locations and further analysis can be done to confirm these as wildfires. Other areas such as power stations burning coal can become anomalies in these datasets.
What was also included in the upload to Azimap was the burn severity for this wildfire. The results can be seen below, Figure 11. This shows the worst affected areas, with the darkest red being the worst affected.
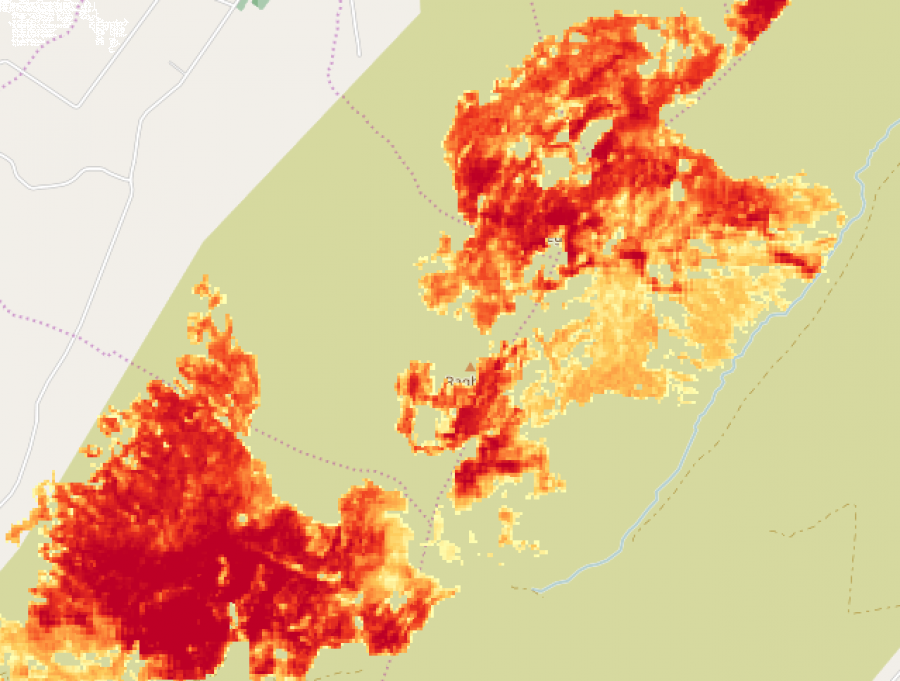
Figure 11 - Polygon in Azimap showing burn severity
This can be compared against the satellite imagery using the layer swipe tool to determine areas worst affected by this burn scar, Figure 12.
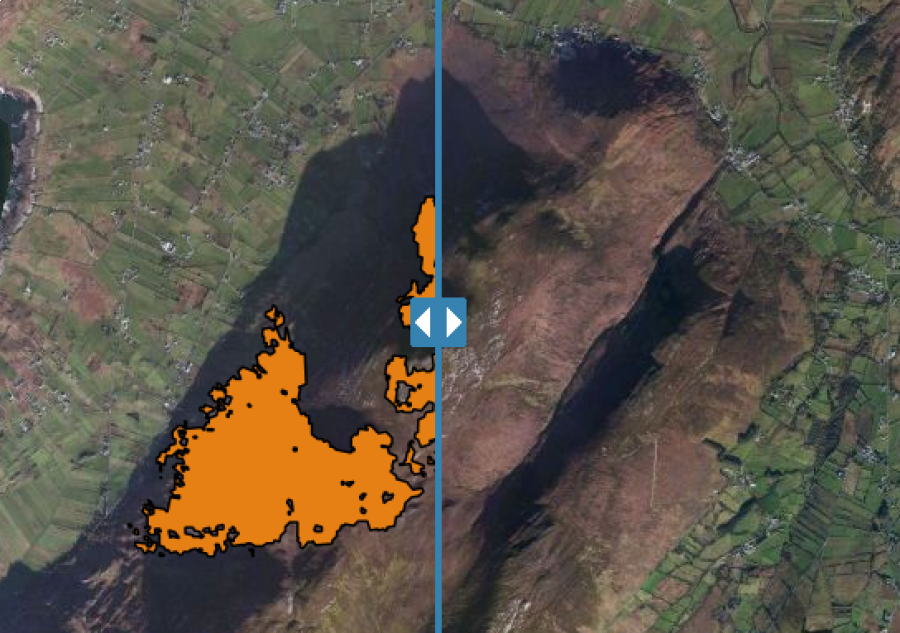
Figure 12 - Layer swipe tool
Comparing against Bing aerial imagery, the area of the burn scar can be seen to take place mostly along the sides of the mountain. The scar appears to stop at the foothills where the pasture fields appear again. This can give important information as to the cause of some of these wildfires.


