


News
Home | News | Preparation of OPW Fluvial Flood Extent & Depth Data
Preparation of OPW Fluvial Flood Extent & Depth Data

OPW Fluvial Flood Extent & Depth Data Project Brief
Prepare the CFRAMS (Catchment Flood Risk Assessment and Management) mapping deliverables from the Office of Public Works (OPW) for Kildare County Council for consumption by Local Authority staff on their native GIS.
Project Background
Flooding has become a significant issue across many areas of Ireland.
With climate change coming into focus on an international level flood management has never been more important.
Flood risk management in Ireland has evolved over time from being primarily focused on the drainage of agricultural land to providing local level flood relief and defence mechanisms and has progressed on to assessing and managing flood risk on a national level.
The OPW, as a lead agency for flood risk management in Ireland, is producing Flood Risk Management Plans (FRMP’s) under the CFRAM Programme.
The CFRAM Programme commenced in 2011 in line with the National Flood Policy and the requirements of the EU ‘Floods’ Directive. The programme was charged with producing a medium to long term strategy for the reduction and management of flood risk in Ireland.

An aerial view of the extensive flooding near the River Shannon in 2015. Photograph: Irish Defence Forces via The Irish Times
The Data
A key component of this strategy is the flood data published to date by the OPW. This data is published in a series of 3 map types;
- Flood Extent Maps; Data indicates the estimated extents, peak water levels and flows associated with the water source modelled e.g. River Barrow
- Flood Depth Maps; Data indicates the estimated depth of flooding at a given location, for a flood event of a particular probability.
- Flood Risk Maps; Data indicates the number of inhabitants, human health, economic activity, environmental areas and pollution sources potentially affected by floods
The likelihood of a flood event is expressed in Annual Exceedance Probability percentage (or AEP).
So, an event with an AEP of 10% has odds of 10:1 to occur in a given year or a ‘one in a ten year’ event and is considered a high probability.
An event with an AEP of 0.1% has odds of 1000:1 or is a ‘one in a thousand year’ event and is considered low probability. 1% AEP is a ‘one in a hundred year’ event or a 100:1 chance and is considered a medium probability.The data also references scenarios which are derived from various allowances and predictive analysis such as hydraulic modelling;
- Current: Scenario reflects the current situation
- MFRS: Mid-Range Future Scenario - represents a ‘likely’ future scenario, based on the wide range of predictive analysis and with the allowances for increased flow, sea level rise, increased rainfall depths, land movement, urbanisation and forestation within the bounds of widely accepted projections.
- HEFS: High-End Future Scenario - represents a more extreme potential future scenario, but one that is nonetheless not significantly outside the range of accepted predictive analysis, and with the allowances for increased flow, sea level rise, increased rainfall depths, land movement, urbanisation and forestation at the upper the bounds of widely accepted projections.
The National CFRAM programme was preceded by The Preliminary Flood Risk Assesment (PFRA) in 2011.
The PFRA was a national high-level screening exercise designed to identify areas in Ireland at a significant risk of flooding. This split the country into numbered Units of Management (UoM) which are then split into a final designation of Areas of Further Assessment (AFAs) which are areas where more detailed assessment is required to develop measures to minimise flood risk.
This is where the Local Authorities consumption of this data comes into play in consultation with CFRAM.
The Requirements
The OPW has an excellent online map viewer for accessing the flood plans in PDF format for each AFA.
However, Local Authorities will often need to disseminate this data across all departments and will need to overlay and combine with their existing datasets in order to maximise the usefulness of this data for day-to-day decision making.
For example, this data needs to be readily available to the Planning Department within the Local Authority so they can assess the risk posed by flooding on planning applications. Following consultation with Kildare County Council’s GIS Co-ordinator the following was determined to be required for all AFA’s (focus on the River Barrow) using the Current Scenario data;
- Fluvial Flood Extent Map – containing 10% Fluvial AEP Event, 1% Fluvial AEP Event & 0.1% Fluvial AEP Event
- Fluvial Flood Depth Maps – one for each AEP category containing depth range;
- 0 – 0.25m
- 0.25m - 0.5m
- 0.5m – 1m
- 1m – 1.5m
- 1.5m – 2m
- >2m
(Explainer! Fluvial: ˈfluːvɪəl/ Adjective; of or found in a river)
The GIS Co-ordinator provided me with a zip file containing the following datasets for each AFA in Kildare;
- 01_ex: Flood Extent (vector)
- 02_dp: Flood Depth (raster)
The Method
1. Flood Extents
The flood extent data is categorised by the AEP percentage, as explained above. Data for each AEP was delivered as a separate shapefile for each Area of Further Assesment (Allenwood, Athy, Castledermot, Monasterevin, Rathangan & Suncroft).
The shapefiles for each AFA (10%, 1% and 0.1% AEP) were merged in ArcGIS using the Merge tool and preserving the AFA ID.
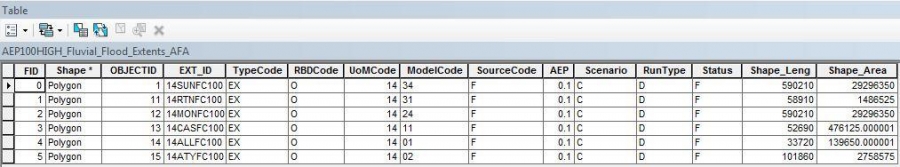
Table for 10% Fuvial Flood Event Layer
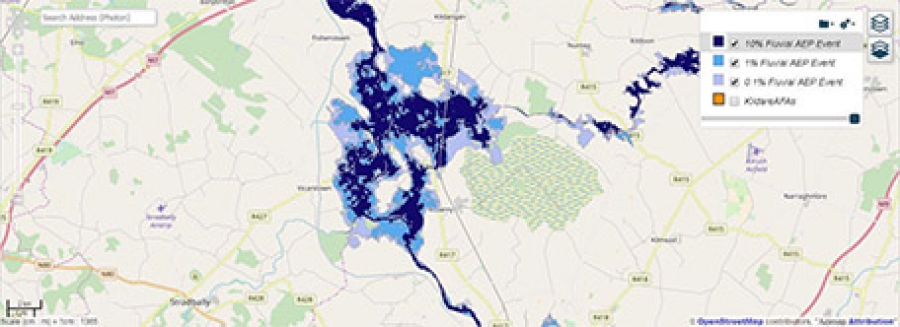
Fluvial Flood Extent Map Kildare
The ‘coarseness’ of the data was queried by KCC upon presentation however, this data is derived from raster with the optimum spatial resolution set by the OPW and we thought it best not to resample for a smoother appearance as this would compromise the original dataset. It’s generally accepted that this is not data degradation as such, as the input data is accurate.
2. Flood Depth
This data was delivered as raster GRID files showing the depth of water during a flood event. Depth data for each AEP (10%, 1% and 0.1% AEP) was delivered as a separate GRID file for each Area of Further Assessment. GRID was originally ESRI’s proprietary raster file format and is suitable for representing geographic processes that vary a lot such as hydrological data and flood models.
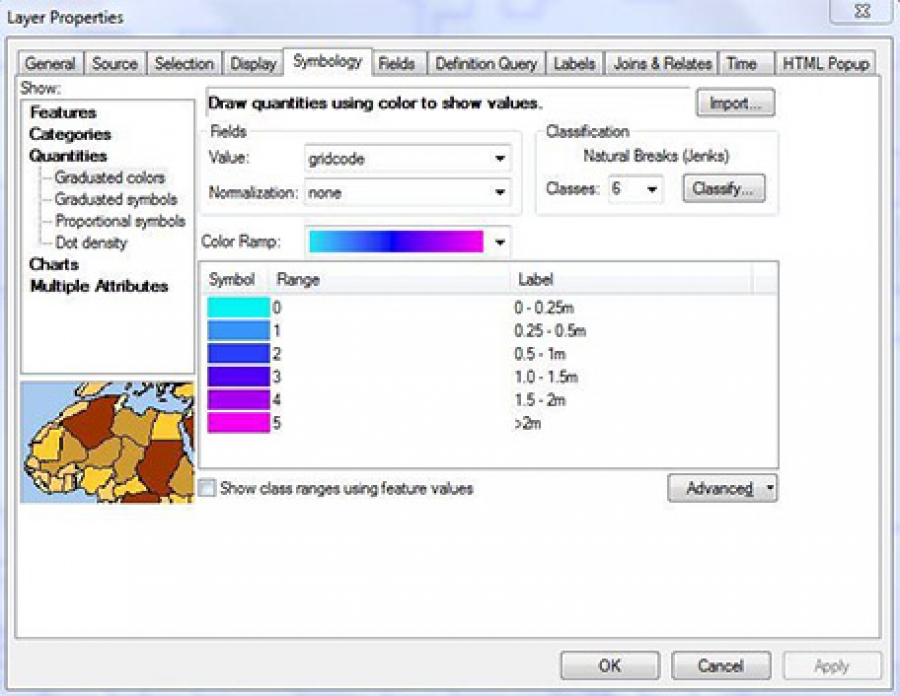
The rasters then needed to be reclassified based on CFRAMS standard metre depth classification as outlined above by KCC. The Reclassify tool in ArcGIS was used based on the depth values and assigning the new values as follows;
- VALUE 0; 0 – 0.25m
- VALUE 1; 0.25m - 0.5m
- VALUE 2; 0.5m – 1m
- VALUE 3; 1m – 1.5m
- VALUE 4; 1.5m – 2m
- VALUE 5; >2m
Using the Raster to Polygon tool in ArcGIS (non-simplified) we converted each raster to vector.
We then added 2 fields for each shapefile – ‘DEPTH’ and ‘AFA’ to enrich the data with the reclassified ranges, as above, in the field ‘gridcode’.
Using the Merge tool again based on AEP value we merged all the Areas of Further Assesment.
The Dissolve tool was used to dissolve individual shapefiles based on ‘gridcode’ until we had 3 single shapefiles for Kildare, each one showing the Fluvial Flood Depth for AEP 10%, 1% and 0.1%.
Styling of both the depth and extent data was kept as close to CFRAMS standard styling as possible;
Epilogue
The project was relatively straight forward with the imperative on disseminating the data among GIS & non-GIS users with a high degree of accuracy.
KCC’s native GIS platform is Mallon Technology’s Azimap. You can view both maps discussed above at the links below;
- 1. Fluvial Flood Extent Map: https://azimuth.azimap.com/publicpages/Default.aspx?MapID=24096
- 2. Fluvial Flood Depth Map: https://azimuth.azimap.com/publicpages/Default.aspx?MapID=24100
Most GIS professionals love acronyms – we just can’t help ourselves.
So, here is a handy glossary of my favourites;
CFRAM: Catchment Flood Risk Assessment and Management
OPW: Office of Public Works KCC: Kildare County Council
AEP: Annual Exceedance Probability is the estimated likelihood of a particular magnitude flood occurring or being exceeded in any given year
MFRS: Mid-Range Future Scenario - represents a ‘likely’ future scenario
HEFS: High-End Future Scenario - represents a more extreme potential future scenario
PFRA: Preliminary Flood Risk Assessment carried out in 2011
UoM: Units of Management
AFA: Areas of Further Assessment where more detailed assessment is required
*Note: All relevant flood information taken from http://www.cfram.ie


